. 2010 Jun 16;29(12):2082-96.
doi: 10.1038/emboj.2010.81. Epub 2010 May 14.

The GCN2-ATF4 pathway is critical for tumour cell survival and proliferation in response to nutrient deprivation

Affiliations

The GCN2-ATF4 pathway is critical for tumour cell survival and proliferation in response to nutrient deprivation

Jiangbin Ye et al. EMBO J. .

Abstract

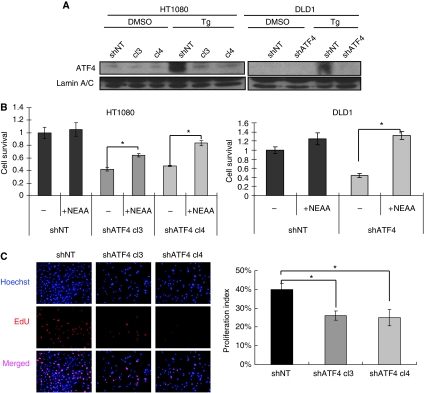
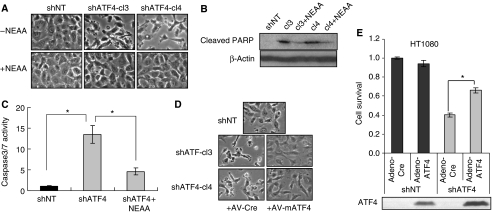
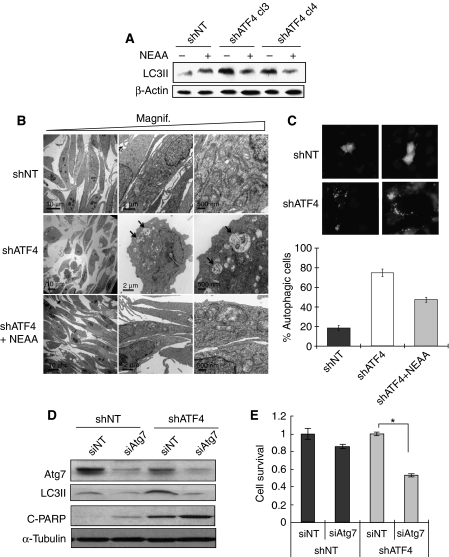
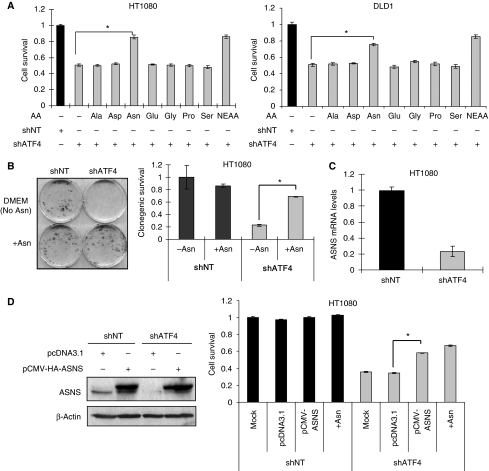
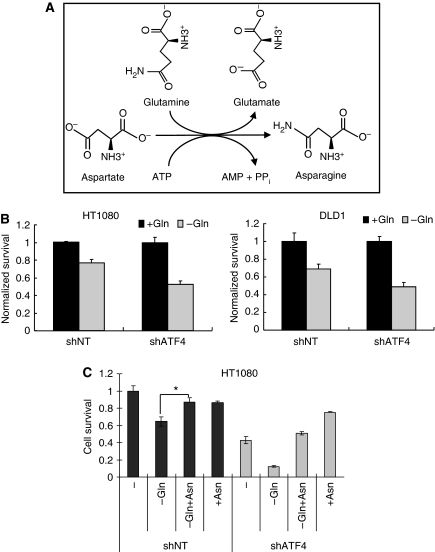
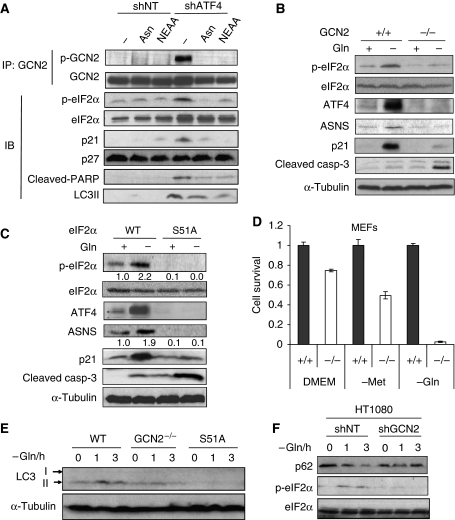
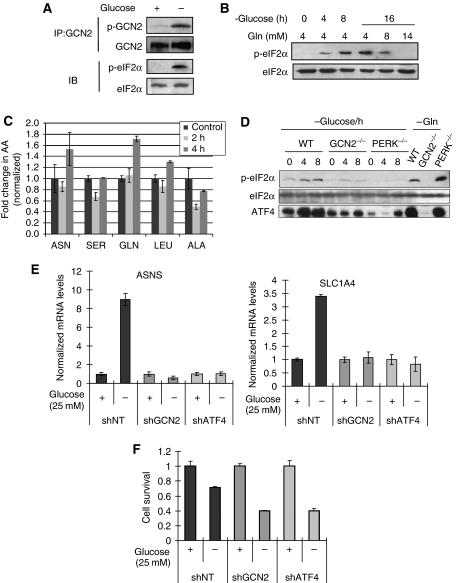
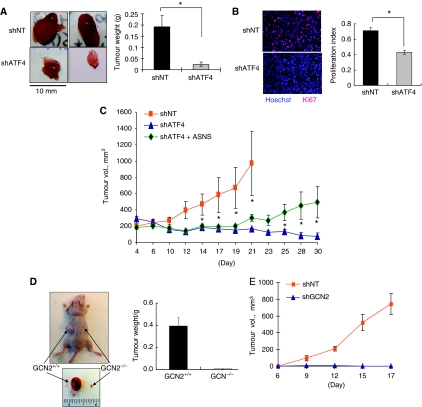
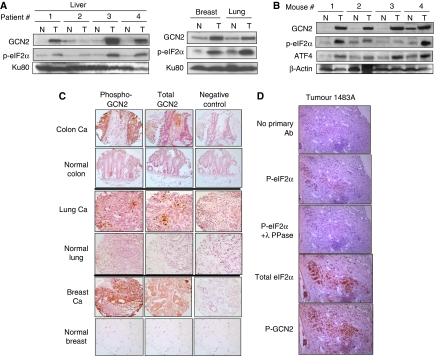
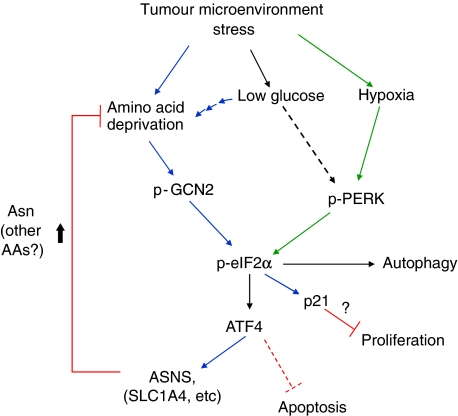
The transcription factor ATF4 regulates the expression of genes involved in amino acid metabolism, redox homeostasis and ER stress responses, and it is overexpressed in human solid tumours, suggesting that it has an important function in tumour progression. Here, we report that inhibition of ATF4 expression blocked proliferation and survival of transformed cells, despite an initial activation of cytoprotective macroautophagy. Knockdown of ATF4 significantly reduced the levels of asparagine synthetase (ASNS) and overexpression of ASNS or supplementation of asparagine in trans, reversed the proliferation block and increased survival in ATF4 knockdown cells. Both amino acid and glucose deprivation, stresses found in solid tumours, activated the upstream eukaryotic initiation factor 2alpha (eIF2alpha) kinase GCN2 to upregulate ATF4 target genes involved in amino acid synthesis and transport. GCN2 activation/overexpression and increased phospho-eIF2alpha were observed in human and mouse tumours compared with normal tissues and abrogation of ATF4 or GCN2 expression significantly inhibited tumour growth in vivo. We conclude that the GCN2-eIF2alpha-ATF4 pathway is critical for maintaining metabolic homeostasis in tumour cells, making it a novel and attractive target for anti-tumour approaches.


Conflict of interest statement

The authors declare that they have no conflict of interest.

Figures

Figure 1
Figure 1
Knockdown of ATF4 inhibits tumour cell survival and proliferation. (A) ATF4 protein levels from the nuclear fractions of thapsigargin-treated (Tg, 1 μM, 4 h) or DMSO-treated cells. Lamin A/C was used as a loading control. (B) Survival of HT1080 and DLD1 cells cultured in the presence or absence of NEAA (100 μM) measured by MTT assay 48 h after plating (Data represent mean±s.e.m., n=3, *P<0.05). Cell survival was normalized to control (shNT cells without NEAA). (C) Cell proliferation assay. HT1080 cells were plated in DMEM with/without NEAA for 24 h. (Left panel) Fluorescent staining for nuclei (Hoechst, blue) and proliferating cells with EdU (red). (Right panel) Three randomly selected photographs were selected and numbers of EdU positive and total nuclei were counted. Percentage proliferation index was calculated by dividing the number of proliferating nuclei by the total number of nuclei. (Data represent mean±s.e.m., n=3, *P<0.05).
Figure 2
Figure 2
Knockdown of ATF4 induces apoptosis in tumour cells. (A) Phase-contrast images of HT1080 shNT and shATF4 cells growing in DMEM with or without NEAA for 24 h. Images shown were taken at × 400 magnification. (B) Immunoblot for cleaved PARP in HT1080 shNT and shATF4 cells. β-Actin was used as a loading control. HT1080 cells were incubated in DMEM with/without NEAA for 24 h. (C) Caspase3/7 activities normalized to total number of cells. HT1080 cells were incubated in DMEM with/without NEAA for 24 h. (D) Phase-contrast images of HT1080 shNT and shATF4 cells infected with the control (Av-Cre) or adenovirus expressing mouse ATF4 (AV-mATF4) indicated at × 400 magnification. After infection, cells were incubated in DMEM without NEAA. Images were taken 24 h after infection. (E) Relative cell survival in infected cells using an MTT assay. Equal numbers of cells were plated in DMEM without NEAA 24 h after infection. MTT assay was performed after 48 h. Cells infected under the same condition were also collected at 24 h after infection for ATF4 immunoblot (bottom panel). (Data represent mean±s.e.m., n=3, *P<0.05).
Figure 3
Figure 3
Knockdown of ATF4 induces protective autophagy in tumour cells. (A) Immunoblot for the autophagy marker cleaved-LC3 from whole cell lysates in HT1080 shNT and shATF4 cells incubated in DMEM with/without NEAA for 24 h. β-Actin was used as a loading control. (B) Electron microscopy imaging. Arrows point to double-membrane-containing autophagosomes. HT1080 cells were incubated in DMEM with/without NEAA for 24 h. (C) Top: HT1080 shNT and shATF4 cells were transfected with pCMV-GFP-LC3 and incubated in DMEM. After 48 h, cells were stained with Hoechst before imaging. Bottom: Quantitation of cells with autophagic (punctate) morphology. Percentage autophagic cells were calculated after normalization to the total number of cells with GFP signal. Data represent mean (±s.e.m., n=3). (D) HT1080 cells were transfected with 100 nM of non-targeting siRNA (siNT) or siRNA targeting Atg7 (siAtg7). Atg7, LC3 and cleaved-PARP levels were analysed by immunoblotting 24 h after transfection. α-Tubulin was used as a loading control. (E) HT1080 cells were transfected with 100 nM non-targeting siRNA (siNT) or siRNA targeting ATG7 (siATG7). After 72 h, cell survival of HT1080 and DLD1 cells was measured by MTT assay. Experiment was carried out in triplicate. (Data represent mean±s.e.m., n=3, *P<0.05).
Figure 4
Figure 4
Supplementation with Asn or overexpression of ASNS rescues survival of shATF4 cells. (A) Survival of HT1080 (left) or DLD1 (right) cells grown in DMEM with indicated amino acids supplemented at a concentration of 100 μM for 48 h. (B) Clonogenic survival of HT1080 shNT/shATF4 cells. Left: Picture of a representative experiment. Right: Clonogenic survival of HT1080 shNT/shATF4 cells. (Data represent mean±s.e.m., n=4, *P<0.05.) (C) ASNS mRNA levels in HT1080 shNT/shATF4 cells measured using real-time RT–PCR. (Data represent mean±s.e.m., n=3, *P<0.05.) (D) ASNS expression and cell survival in transfected HT1080 cells. (Left panel) Top bands represent HA-tagged ASNS, lower bands represent endogenous ASNS. (Right panel) Survival of HT1080 shNT and shATF4 cells after indicated treatments. After 24 h, transfected cells were harvested for immunoblot or plated for MTT assay (48 h). (Data represent mean±s.e.m., n=3, *P<0.05).
Figure 5
Figure 5
Knockdown of ATF4 increases sensitivity to glutamine deprivation. (A) The biosynthetic reaction catalysed by ASNS. (B) Survival of HT1080 (left panel) or DLD1 (right panel) cells grown in DMEM with/without 4 mM L-glutamine for 48 h. (C) Survival of HT1080 cells in DMEM with/without Gln or Asn for 48 h. Gln: 4 mM, Asn: 100 μM. (Data represent mean±s.e.m., n=3, *P<0.05).
Figure 6
Figure 6
Activation of GCN2-eIF2α pathway under amino acid deprivation promotes cell survival, upregulates ATF4 and p21, and activates autophagy. (A) HT1080 shNT and shATF4 cells were incubated in the media indicated for 24 h. Whole cell lysates were harvested for immunoblot (IB) or immunoprecipitation (IP) with the indicated antibodies. (B) GCN2+/+ and GCN2−/− MEFs were incubated with/without 4 mM Gln for 24 h and immunoblotting was performed. (C) eIF2α wt or eIF2α S51A mutant MEFs were incubated with/without 4 mM Gln for 24 h and immunoblotting was performed with indicated antibodies. Numbers below the blots of p-eIF2a and ASNS indicate fold change in levels normalized to those of α-tubulin. Analysis was performed using the Scion Image version of the NIH Image shareware image analysis program. (D) GCN2+/+ and GCN2−/− MEFs were incubated with or without Met or Gln for 48 h. Cell survival was analysed using MTT assay. (Data represent mean±s.e.m., n=3, *P<0.05.) (E) Wild-type, GCN2−/− and eIF2α S51A mutant MEFs were cultured without 4 mM Gln for 1 h or 3 h, cell lysates were subjected to immunoblotting. (F) HT1080 cells stably transfected with shNT or shGCN2 plasmid were cultured without Gln for 1 or 3 h, cell lysates were subjected to immunoblotting with indicated antibodies.
Figure 7
Figure 7
Glucose deprivation activates the GCN2-eIF2α-ATF4 pathway. (A) HT1080 cells were incubated with/without 25 mM glucose for 16 h. Whole cell lysates (WL) were harvested for immunoblot (IB) or immunoprecipitation (IP). (B) HT1080 cells were incubated in glucose-free DMEM for up to 16 h with indicated concentrations of glutamine added and lysates were subjected to immunoblotting. (C) Cells were deprived of Glucose for 2 and 4 h and the levels of individual amino acids were analysed by LC-MS. (D) Wild-type, GCN2−/− and PERK−/− MEFs were incubated in glucose-free DMEM for up to 8 h, cells were harvested for immunoblot. Glutamine deprivation treatment was for 4 h. (E) HT1080 cells were incubated with/without 25 mM glucose for 8 h, total RNA was extracted for real-time PCR for the ATF4 targets ASNS (left) or SLC1A4 (right). (F) HT1080 cells were cultured with/without 25 mM glucose, 2 × 10⁴ cells/well. shATF4 cells were supplemented with 1 × NEAA. After 24 h, cell survival was measured using MTT assay and survival was normalized to that of the high glucose group.
Figure 8
Figure 8
Inhibition of GCN2-ATF4 pathway blocks tumour growth in vivo. (A) Left panel: Xenografted tumours from HT1080 shNT/shATF4 cells in nude mice injected in each side with 2 × 10⁶ cells. Tumours grew for 3 weeks. Right panel: Average tumour weight at conclusion of experiment (N=10, *P<0.05, one-tailed Student's t-test). (B) Left panel: Immunofluorescent staining for Ki67 (red) in tumour sections. Nuclei were counterstained with Hoechst 33342 (blue). Tumours were photographed at × 200 magnification. Right panel: The quantification of Ki67 signal. (C) Growth of HT1080 shNT, shATF4 and shATF4+ASNS tumour xenografts. Nu/Nu mice were injected in each side with 2 × 10⁶ HT1080 cells (N=8). Four days after injection, tumour volume was measured every 2–3 days. Error bars represent s.e. values. *P<0.05, Student's two-tailed t-test. (D) Growth of K-RasV12-transformed GCN2+/+ and GCN2−/− MEFs in vivo. Nu/Nu mice were injected in each side with 2.5 × 10⁶ MEFs. Tumours grew for 9 days. At the end of the experiment, tumours were excised, photographed (left) and weighed (right). (N=4, *P<0.05, one-tailed Student's t-test). (E) Growth of HT1080 shNT and shGCN2 tumour xenografts. Nu/Nu mice were injected in each side with 2 × 10⁶ shNT (N=7) or shGCN2 cells (N=10). Six days after injection, tumour volume was measured every 2–3 days.
Figure 9
Figure 9
The GCN2/p-eIF2α pathway is activated in human and mouse spontaneous tumours. (A) Immunoblots for GCN2 and p-eIF2α in human tumour tissue (T) and corresponding normal tissue (N) samples. Ku80 was used as a loading control. (B) Immunoblots for GCN2, p-eIF2α and ATF4 in normal (N) and tumour (T) samples from a mammary tumour-prone MMTV-Neu mouse strain. Immunoblotting for β-actin was used as a loading control. (C) Expression of p-GCN2 and total GCN2 in human normal and tumour tissues from the NIH TARP consortium. Staining using only the secondary antibody was used as a negative control. Images were taken under × 40 magnification. (D) Expression of P-GCN2, P-eIF2α, total GCN2 and total eIF2α in serial sections of human colorectal metastatic cancer to liver. Specificity of p-eIF2α staining is demonstrated by decreased signal in sample treated with λ phosphatase (λ-PPase) before antibody incubation.
Figure 10
Figure 10
A model for the function of GCN2, ATF4, ASNS and Asn in conferring tumour cell protection from microenvironment stress. Blue arrows indicate signalling primarily in response nutrient deprivation stress and green arrows indicate signalling primarily from hypoxic stress. Common pathways are indicated by black arrows. ATF4 likely has additional functions in response to hypoxia that are not depicted here.

Comment in

  • How do tumours adapt to nutrient stress?
    Wek RC, Staschke KA. Wek RC, et al. EMBO J. 2010 Jun 16;29(12):1946-7. doi: 10.1038/emboj.2010.110. EMBO J. 2010. PMID: 20551969 Free PMC article. No abstract available.

References

    1. Ameri K, Lewis CE, Raida M, Sowter H, Hai T, Harris AL (2004) Anoxic induction of ATF-4 through HIF-1-independent pathways of protein stabilization in human cancer cells. Blood 103: 1876–1882 - PubMed
    1. Anthony TG, McDaniel BJ, Byerley RL, McGrath BC, Cavener DR, McNurlan MA, Wek RC (2004) Preservation of liver protein synthesis during dietary leucine deprivation occurs at the expense of skeletal muscle mass in mice deleted for eIF2 kinase GCN2. J Biol Chem 279: 36553–36561 - PubMed
    1. Aslanian AM, Fletcher BS, Kilberg MS (2001) Asparagine synthetase expression alone is sufficient to induce l-asparaginase resistance in MOLT-4 human leukaemia cells. Biochem J 357: 321–328 - PMC - PubMed
    1. Bi M, Naczki C, Koritzinsky M, Fels D, Blais J, Hu N, Harding H, Novoa I, Varia M, Raleigh J, Scheuner D, Kaufman RJ, Bell J, Ron D, Wouters BG, Koumenis C (2005) ER stress-regulated translation increases tolerance to extreme hypoxia and promotes tumor growth. EMBO J 24: 3470–3481 - PMC - PubMed
    1. Cooney DA, Handschumacher RE (1970) L-asparaginase and L-asparagine metabolism. Annu Rev Pharmacol 10: 421–440 - PubMed

Publication types

LinkOut - more resources