. 2010 Jun;28(6):617-623.
doi: 10.1038/nbt.1628. Epub 2010 May 16.

Analysis of a genome-wide set of gene deletions in the fission yeast Schizosaccharomyces pombe

Affiliations

Analysis of a genome-wide set of gene deletions in the fission yeast Schizosaccharomyces pombe

Dong-Uk Kim et al. Nat Biotechnol. 2010 Jun.

Erratum in

  • Nat Biotechnol. 2010 Dec;28(12):1308

Abstract

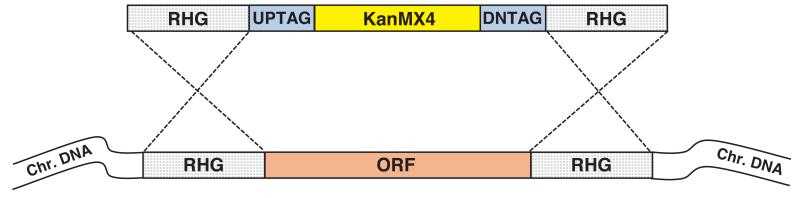
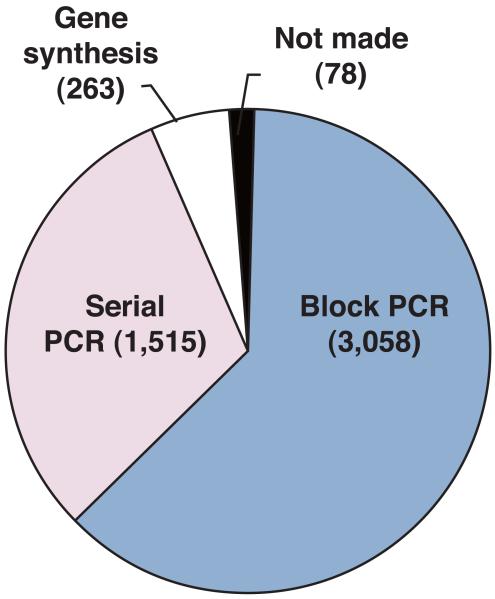
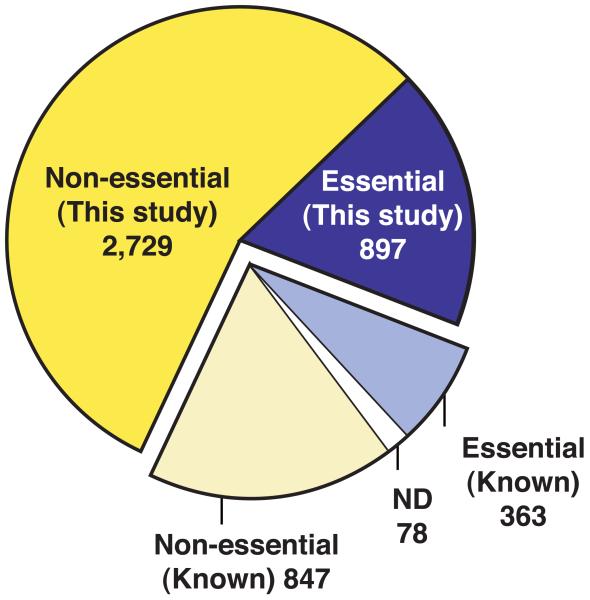
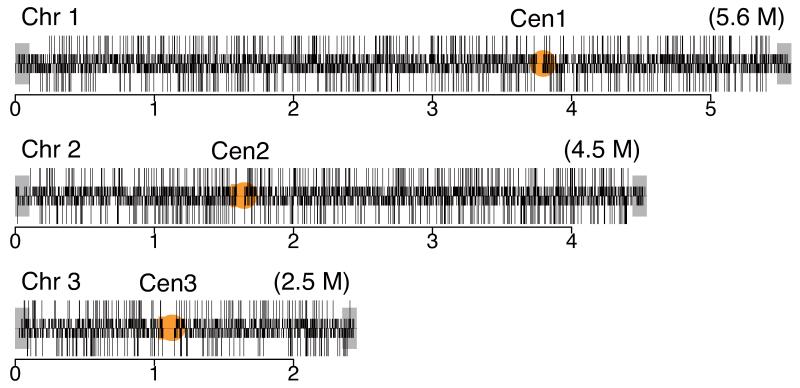
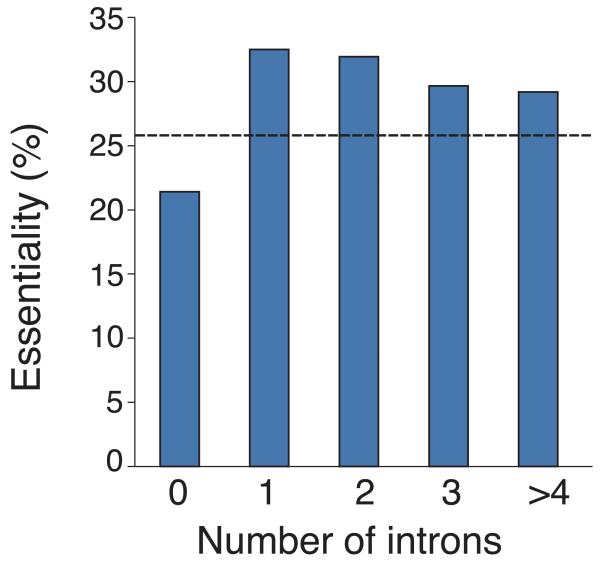
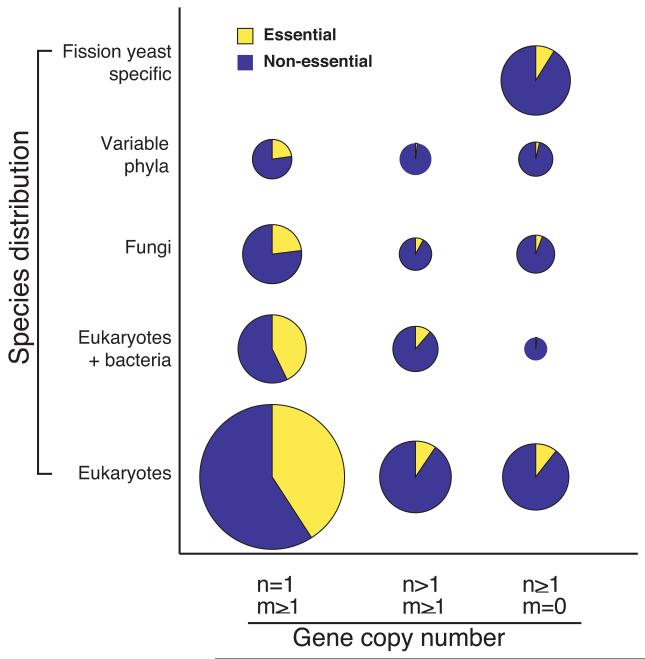
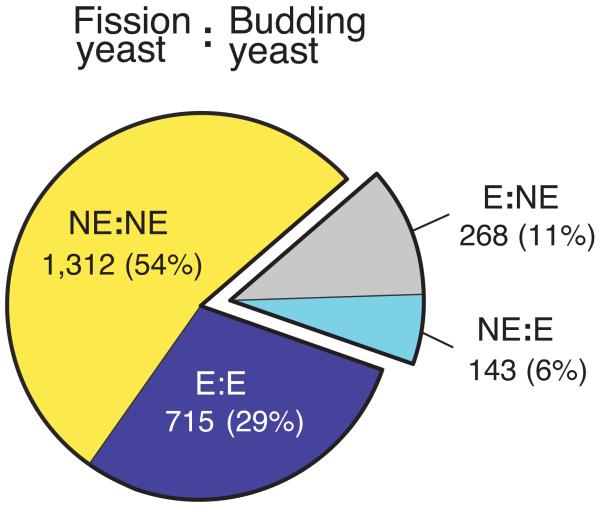
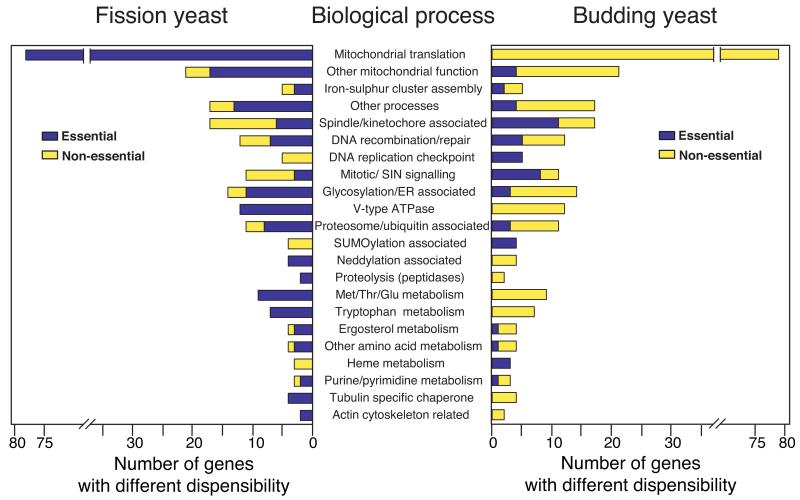
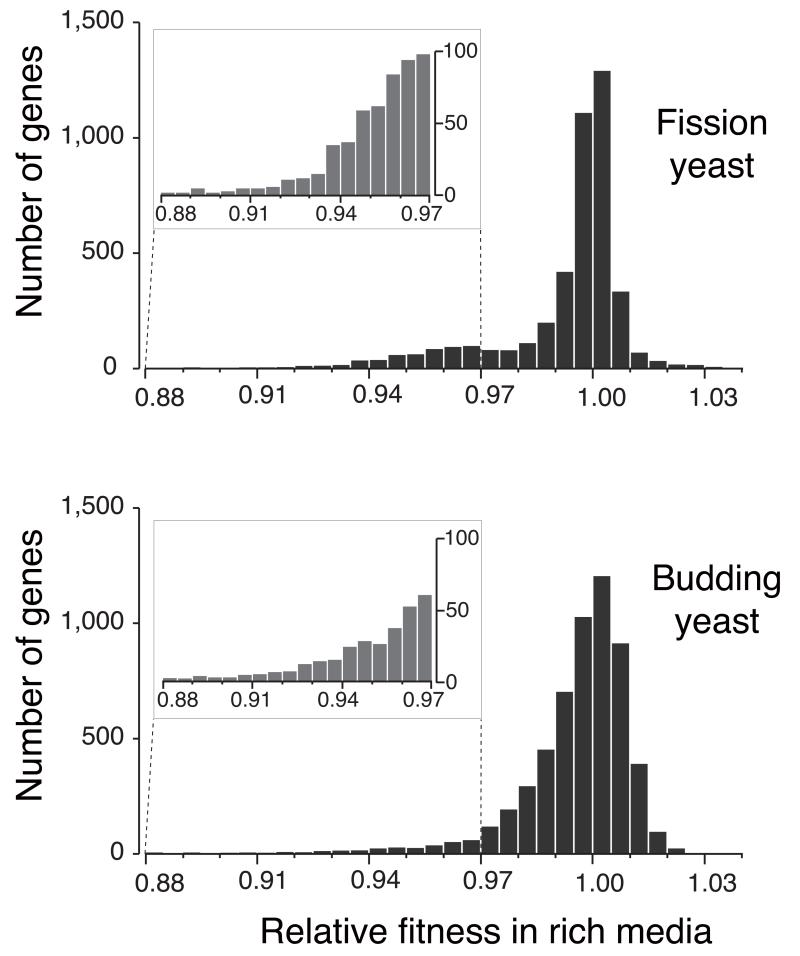
We report the construction and analysis of 4,836 heterozygous diploid deletion mutants covering 98.4% of the fission yeast genome providing a tool for studying eukaryotic biology. Comprehensive gene dispensability comparisons with budding yeast--the only other eukaryote for which a comprehensive knockout library exists--revealed that 83% of single-copy orthologs in the two yeasts had conserved dispensability. Gene dispensability differed for certain pathways between the two yeasts, including mitochondrial translation and cell cycle checkpoint control. We show that fission yeast has more essential genes than budding yeast and that essential genes are more likely than nonessential genes to be present in a single copy, to be broadly conserved and to contain introns. Growth fitness analyses determined sets of haploinsufficient and haploproficient genes for fission yeast, and comparisons with budding yeast identified specific ribosomal proteins and RNA polymerase subunits, which may act more generally to regulate eukaryotic cell growth.


Figures

Figure 1
Figure 1
Deletion construction and gene dispensability. (a) Gene deletion cassette containing the KanMX4 gene flanked by unique barcodes (UPTAG/DNTAG) and regions of homology to the gene of interest (RHG). The cassette replaced the ORF of interest by homologous recombination at the RHG regions. (b) Construction of deletion mutants. All 4,836 protein coding genes were deleted using serial extension PCR (31.3%), block PCR (63.2%), or total gene synthesis (5.4%). The remaining 78 genes could not be confirmed as deleted due to ambiguous sequencing results, recombination failure, or inviability of the heterozygous diploids. (c) Dispensability of 4,836 protein coding genes. For 3,626 (2,729+897) genes the dispensability was previously unknown. ND=not done.
Figure 1
Figure 1
Deletion construction and gene dispensability. (a) Gene deletion cassette containing the KanMX4 gene flanked by unique barcodes (UPTAG/DNTAG) and regions of homology to the gene of interest (RHG). The cassette replaced the ORF of interest by homologous recombination at the RHG regions. (b) Construction of deletion mutants. All 4,836 protein coding genes were deleted using serial extension PCR (31.3%), block PCR (63.2%), or total gene synthesis (5.4%). The remaining 78 genes could not be confirmed as deleted due to ambiguous sequencing results, recombination failure, or inviability of the heterozygous diploids. (c) Dispensability of 4,836 protein coding genes. For 3,626 (2,729+897) genes the dispensability was previously unknown. ND=not done.
Figure 2
Figure 2
Analysis of gene dispensability. (a) Chromosome distribution of gene dispensability. Essential genes (tall bars) and non-essential genes (short bars) are distributed randomly throughout the genome except within 100 kb of the telomeres (grey boxes) where non-essential genes are enriched. Upper bars represent genes transcribed left to right and lower bars represent genes transcribed right to left. Filled circles in orange represent centromeres. (b) Essentiality vs. number of introns. Gene dispensability was plotted against the number of introns within genes. In fission yeast the essentiality of genes containing introns is significantly (P<10−14) higher than genes lacking introns. The dotted line represents the average essentiality for the total gene set (26.1%). (c) Essentiality vs. ORFeome localization. The percentage of essential genes was plotted against 10 different cellular locations in fission yeast. The dotted line represents the average essentiality for the total gene set (26.1%). The number of essential gene products localised to the nucleolus, spindle pole body, and nuclear envelope is higher than average. The number of essential genes compared to the total for each location is; 1) cytoplasm 564/2,113, 2) nucleus 601/2,068, 3) mitochondrion 128/450, 4) ER 98/436, 5) cell periphery 55/326, 6) nucleolus 89/217, 7) Golgi 27/224, 8) spindle pole body 69/181, 9) nuclear envelope 29/76, and 10) microtubule 20/71. (d) Comparison of GO analysis between fission yeast and budding yeast genes. Bar chart shows a selection of broad, biologically informative GO terms significantly (P≤0.01) enriched for essential and non-essential genes in fission yeast and budding yeast. For the complete list of processes and for methods used to extract this data, see Supplementary Tables 5 and 6. Essential fission yeast genes (red), essential budding yeast genes (blue), non-essential genes (white), y axis (biological processes), and x axis (gene number).
Figure 2
Figure 2
Analysis of gene dispensability. (a) Chromosome distribution of gene dispensability. Essential genes (tall bars) and non-essential genes (short bars) are distributed randomly throughout the genome except within 100 kb of the telomeres (grey boxes) where non-essential genes are enriched. Upper bars represent genes transcribed left to right and lower bars represent genes transcribed right to left. Filled circles in orange represent centromeres. (b) Essentiality vs. number of introns. Gene dispensability was plotted against the number of introns within genes. In fission yeast the essentiality of genes containing introns is significantly (P<10−14) higher than genes lacking introns. The dotted line represents the average essentiality for the total gene set (26.1%). (c) Essentiality vs. ORFeome localization. The percentage of essential genes was plotted against 10 different cellular locations in fission yeast. The dotted line represents the average essentiality for the total gene set (26.1%). The number of essential gene products localised to the nucleolus, spindle pole body, and nuclear envelope is higher than average. The number of essential genes compared to the total for each location is; 1) cytoplasm 564/2,113, 2) nucleus 601/2,068, 3) mitochondrion 128/450, 4) ER 98/436, 5) cell periphery 55/326, 6) nucleolus 89/217, 7) Golgi 27/224, 8) spindle pole body 69/181, 9) nuclear envelope 29/76, and 10) microtubule 20/71. (d) Comparison of GO analysis between fission yeast and budding yeast genes. Bar chart shows a selection of broad, biologically informative GO terms significantly (P≤0.01) enriched for essential and non-essential genes in fission yeast and budding yeast. For the complete list of processes and for methods used to extract this data, see Supplementary Tables 5 and 6. Essential fission yeast genes (red), essential budding yeast genes (blue), non-essential genes (white), y axis (biological processes), and x axis (gene number).
Figure 3
Figure 3
Comparative analysis of gene dispensability profiles of fission yeast. Gene dispensability profiles of 4,836 deletion mutants by gene copy number of fission yeast orthologues compared to budding yeast (x-axis) and species distribution (y-axis). Compared to budding yeast, fission yeast genes consist of 2,841 single copy genes (n=1, m ≥1), 855 duplicated genes (n>1, m ≥1), and 1,140 genes found in fission yeast but not in budding yeast (n≥1, m=0), where ‘n’ is the number of genes in fission yeast and ‘m’ is the number of genes in budding yeast. The term ‘eukaryotes’ includes human and the term ‘variable phyla’ includes plants. The area of each circle represents the numbers of genes, where essential and non-essential genes are represented by yellow and blue, respectively.
Figure 4
Figure 4
Dispensability comparison of orthologous pairs from the two yeasts. (a) Essentiality of non-redundant 2,438 orthologous pairs were compared between the two yeasts. 83% of orthologues shows conserved dispensability and the remaining 17% shows different dispensability. E=essential and NE=non-essential. (b) Functional distribution of orthologues with different dispensability. The 17% of the orthologous pairs with different dispensability were allocated to one of 31 biological terms, 22 of which are shown here. For the complete list of processes and genes, see Supplementary Table 14. Note that genes annotated to mitochondrial functions, certain amino acid metabolic pathways, and protein degradation pathways such as neddylation and sumoylation are mostly essential in one yeast and non-essential in the other yeast, whilst other categories show essential genes (although the specific genes are different) in both yeasts under the condition used in this study. Because there are some differences in the constituents of the standard rich media used for each organism it is possible that in a few cases different dispensability between the two organisms may be due to these differences.
Figure 4
Figure 4
Dispensability comparison of orthologous pairs from the two yeasts. (a) Essentiality of non-redundant 2,438 orthologous pairs were compared between the two yeasts. 83% of orthologues shows conserved dispensability and the remaining 17% shows different dispensability. E=essential and NE=non-essential. (b) Functional distribution of orthologues with different dispensability. The 17% of the orthologous pairs with different dispensability were allocated to one of 31 biological terms, 22 of which are shown here. For the complete list of processes and genes, see Supplementary Table 14. Note that genes annotated to mitochondrial functions, certain amino acid metabolic pathways, and protein degradation pathways such as neddylation and sumoylation are mostly essential in one yeast and non-essential in the other yeast, whilst other categories show essential genes (although the specific genes are different) in both yeasts under the condition used in this study. Because there are some differences in the constituents of the standard rich media used for each organism it is possible that in a few cases different dispensability between the two organisms may be due to these differences.
Figure 5
Figure 5
A comparison of the relative growth rates for the total set of heterozygous deletion diploids in fission yeast (4,334 genes) and budding yeast (5,921 genes). The relative growth rate is shown on the x-axis and the number of genes on the y-axis. In fission yeast there are more haploinsufficient genes with a relative growth rate of <0.97 compared to budding yeast (455 vs. 356), as shown in the expanded region 0.88-0.97 (see also Supplementary Table 16).

References

    1. Jorgensen P, et al. High-resolution genetic mapping with ordered arrays of Saccharomyces cerevisiae deletion mutants. Genetics. 2002;162:1091–1099. - PMC - PubMed
    1. Hillenmeyer ME, et al. The chemical genomic portrait of yeast: uncovering a phenotype for all genes. Science. 2008;320:362–365. - PMC - PubMed
    1. Giaever G, et al. Functional profiling of the Saccharomyces cerevisiae genome. Nature. 2002;418:387–391. - PubMed
    1. Winzeler EA, et al. Functional characterization of the S. cerevisiae genome by gene deletion and parallel analysis. Science. 1999;285:901–906. - PubMed
    1. Entian KD, Kotter P. Yeast genetic strain and plasmid collections. Edn. II Vol. 36. Elsevier Ltd; 2007.

Publication types

MeSH terms

LinkOut - more resources