. 2010 Jun;16(6):665-70.
doi: 10.1038/nm.2143. Epub 2010 May 9.

ERK activation drives intestinal tumorigenesis in Apc(min/+) mice

Affiliations

ERK activation drives intestinal tumorigenesis in Apc(min/+) mice

Sung Hee Lee et al. Nat Med. 2010 Jun.

Abstract

Toll-like receptor (TLR) signaling is essential for intestinal tumorigenesis in Apc(min/+) mice, but the mechanisms by which Apc enhances tumor growth are unknown. Here we show that microflora-MyD88-ERK signaling in intestinal epithelial cells (IECs) promotes tumorigenesis by increasing the stability of the c-Myc oncoprotein. Activation of ERK (extracellular signal-related kinase) phosphorylates c-Myc, preventing its ubiquitination and subsequent proteasomal degradation. Accordingly, Apc(min/+)/Myd88(-/-) mice have lower phospho-ERK (p-ERK) levels and fewer and smaller IEC tumors than Apc(min/+) mice. MyD88 (myeloid differentiation primary response gene 88)-independent activation of ERK by epidermal growth factor (EGF) increased p-ERK and c-Myc and restored the multiple intestinal neoplasia (Min) phenotype in Apc(min/+)/Myd88(-/-) mice. Administration of an ERK inhibitor suppressed intestinal tumorigenesis in EGF-treated Apc(min/+)/Myd88(-/-) and Apc(min/+) mice and increased their survival. Our data reveal a new facet of oncogene-environment interaction, in which microflora-induced TLR activation regulates oncogene expression and related IEC tumor growth in a susceptible host.


Conflict of interest statement

The authors declare that they have no competing financial interest.

Figures
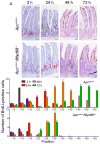
Figure 1
Figure 1. Genetic disruption of Myd88 in Apcmin/+ mice suppresses proliferation and enhances apoptosis of IEC
A. IHC and BrdU incorporation in IEC (DSI) after i.p. BrdU injection (scale bars - 20 μm, magnification ×200). BrdU-positive cells, per time point, were enumerated for each indicated position in a crypt (10 crypt-villi units/time point), position 0 being the base of the crypt . B. Apoptotic IEC (DSI) were determined by TUNEL assay (scale bars - 40 μm, magnification ×100). C. Cleaved product of poly(ADP-ribose) polymerase (PARP) in IEC (DSI) harvested from the indicated mice (n=2/group).
Figure 2
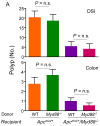
Figure 2. Myd88 signaling in hematopoietic cells is not required for tumorigenesis in Apcmin/+ mice
A. Polyp count in BM chimeras in the DSI and colon (P=n.s, n=7-9 mice/group). B. Polyp count in the small intestine in Apcmin/+/Il1r1-/- and Apcmin/+/caspase-1-/- mice at 20 weeks of age (n=7/group). C. Polyp count in Anakinra-treated Apcmin/+ mice (DSI) (P=n.s., n=7/group).
Figure 3
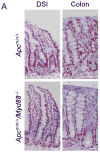
Figure 3. MyD88 regulates c-myc expression levels
A. IHC analysis of c-myc protein in IEC from the DSI and colon from 20-week old mice (scale bars, 10 μm, magnification ×200). B. IB analysis of the indicated proteins in IEC (DSI) of 20-weeks mice (n=2). C. Transcript levels of c-myc in IEC (DSI) (P=n.s, n=3/group). D. RKO cells transfected with either control or Myd88 siRNA, were stimulated with Wnt3a (100ng/ml) and subjected to IB analysis.
Figure 4
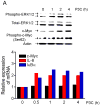
Figure 4. TLR signaling via MyD88 stabilizes c-myc protein in IEC through activation of ERK
A. Upper panel: RKO cells were stimulated with P3C (2 μg/ml), lysed and analyzed by IB. Lower panel: Transcript levels after TLR2 stimulation (qPCR). B. Protein levels (IB) (Upper panel) and transcript level (qPCR) (Lower panel) in MG-132 treated (10 μM) RKO cells. C-myc was immunoprecipitated followed by IB with anti-ubiquitin (Ub) ab. C. RKO cells were treated with P3C (2 μg/ml) and ubiquitinated c-myc level was measured by IP followed by IB. D. Phospho-ERK and c-myc levels (IB) in U0126- or PD0325901-treated RKO cells.
Figure 5
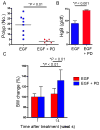
Figure 5. Activation of ERK restores the Min phenotype in Apcmin/+/Myd88-/- mice
A. PD reduces the number of polyps in EGF-treated Apcmin/+/Myd88-/- mice (DSI) (n=8/group). B. Blood hemoglobin levels and (C) body weight of these mice. D. Top panel: H&E of DSI in control, EGF-treated, and EGF + PD-treated mice. The arrows indicate intestinal polyps. Middle panel: C-myc expression in IEC. Bottom panel: Phospho-ERK levels in IEC of these mice.
Figure 6
Figure 6. Activation of ERK is essential for the Min phenotype in Apcmin/+ mice
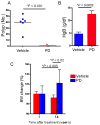
A. Polyp count, B hemoglobin level, and C body weight in PD-treated Apcmin/+ mice (n=6 for vehicle, n=9 for PD group). D. Upper panel: H&E of DSI in control and PD-treated Apcmin/+ mice. Arrows indicate intestinal polyps. Lower panel: C-myc expression in IEC. E. IB analysis of c-myc and pERK levels in IEC (DSI) of these mice. F. Survival in PD-treated or vehicle-treated Apcmin/+ mice for 17 weeks (n=8). G. The PD-treated Apcmin/+ mice mentioned in F were split to PD- and vehicle-treated groups (n=4/group). Polyp count (DSI) was performed 15 weeks later. H. The microflora induces tumorigenesis in Apcmin/+ mice by triggering TLR-ERK pathway in IEC. This stabilizes c-myc and inhibits its proteasomal degradation. Increased c-myc levels induce the Min phenotype. Additional signals such as growth factors, utilize the MEK-ERK pathway and similarly to TLR ligands, can enhance c-myc levels. Of note, sterile food and water still contain TLR ligands (e.g., LPS) that are capable of stimulating IEC. This mechanism may account for the Min phenotype observed in Apcmin/+ mice housed under germ-free conditions .

Comment in

References

    1. Michelsen KS, Arditi M. Toll-like receptors and innate immunity in gut homeostasis and pathology. Curr Opin Hematol. 2007;14:48–54. - PubMed
    1. Sanderson IR, Walker WA. TLRs in the Gut I. The role of TLRs/Nods in intestinal development and homeostasis. Am J Physiol Gastrointest Liver Physiol. 2007;292:G6–10. - PMC - PubMed
    1. de Visser KE, Eichten A, Coussens LM. Paradoxical roles of the immune system during cancer development. Nat Rev Cancer. 2006;6:24–37. - PubMed
    1. Karin M. Nuclear factor-kappaB in cancer development and progression. Nature. 2006;441:431–436. - PubMed
    1. Lin WW, Karin M. A cytokine-mediated link between innate immunity, inflammation, and cancer. J Clin Invest. 2007;117:1175–1183. - PMC - PubMed

Publication types

MeSH terms

Substances