. 2010 Aug;73(6):629-41.
doi: 10.1007/s11103-010-9645-0. Epub 2010 May 15.

Over-expression of the IGI1 leading to altered shoot-branching development related to MAX pathway in Arabidopsis

Affiliations

Over-expression of the IGI1 leading to altered shoot-branching development related to MAX pathway in Arabidopsis

Indeok Hwang et al. Plant Mol Biol. 2010 Aug.

Abstract

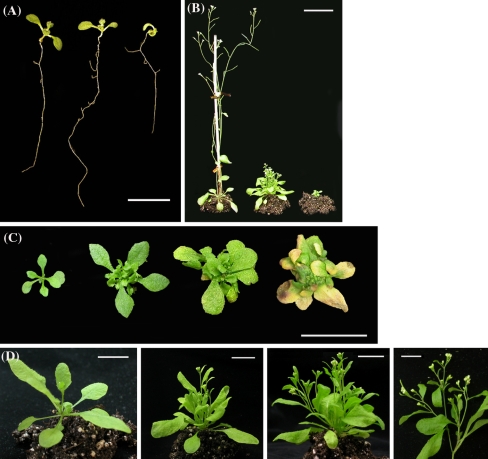
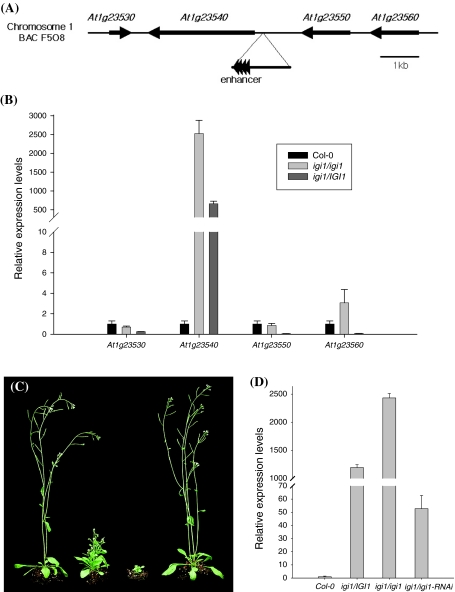
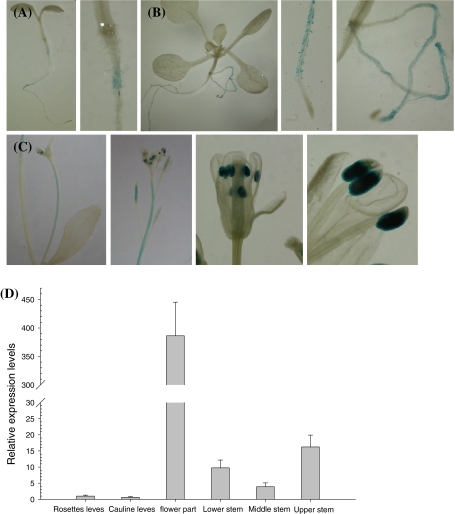
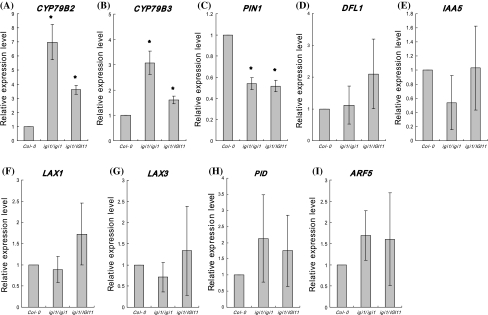
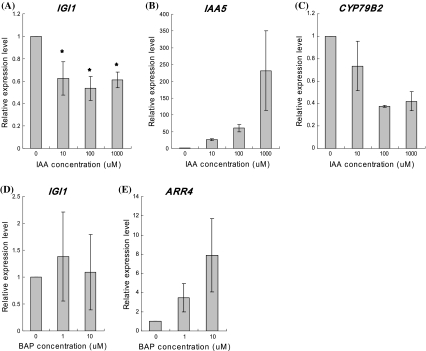
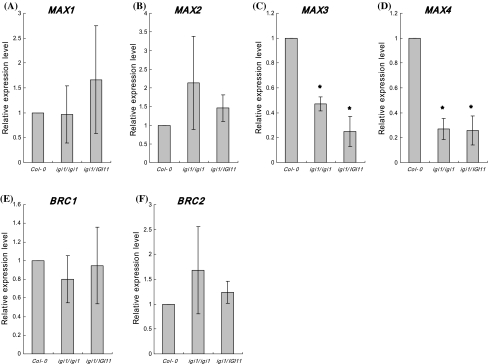
Shoot branching and growth are controlled by phytohormones such as auxin and other components in Arabidopsis. We identified a mutant (igi1) showing decreased height and bunchy branching patterns. The phenotypes reverted to the wild type in response to RNA interference with the IGI1 gene. Histochemical analysis by GUS assay revealed tissue-specific gene expression in the anther and showed that the expression levels of the IGI1 gene in apical parts, including flowers, were higher than in other parts of the plants. The auxin biosynthesis component gene, CYP79B2, was up-regulated in igi1 mutants and the IGI1 gene was down-regulated by IAA treatment. These results indicated that there is an interplay regulation between IGI1 and phytohormone auxin. Moreover, the expression of the auxin-related shoot branching regulation genes, MAX3 and MAX4, was down-regulated in igi1 mutants. Taken together, these results indicate that the overexpression of the IGI1 influenced MAX pathway in the shoot branching regulation.


Figures

Fig. 1
Fig. 1
Morphology of mutants. a Phenotype of 10-day-old plants. From left to right, Col-0, heterozygous and homozygous mutant. Scale bar: 5 cm. b Phenotype of 25-day-old plants. From left to right, Col-0, heterozygous and homozygous mutant. Decreased plant height and increased axillary branches are displayed in the heterozygous mutant. The homozygous mutant displays no inflorescence and abnormal flowers. Scale bar: 5 cm. c The phenotype of the homozygous mutant during different growth stages. From left to right, 10, 20, 30, and 40-day-old plants. Scale bar: 2 cm. d The phenotype of the heterozygous mutant during different growth stages. Each panel shows a 20-day-old plant (first panel), 25-day-old plant (second panel), 30-day-old plant (third panel), and multiple axillary inflorescences of the 35-day-old plant (fourth panel). Scale bar 2 cm for the first to third panel and 1 cm for the fourth panel
Fig. 2
Fig. 2
Identification of IGI1. a T-DNA position in the igi1 mutants. BAC F5O8 clone is shown. There is a T-DNA insertion 200 bp upstream of the At1g23540 gene coding region. b The expression level of neighboring genes near the T-DNA. The real time PCR results show that the At1g23540 gene transcript was dramatically increased in igi1 mutants. Actin was used for normalization and the error bars indicate the standard deviation. c Phenotype of the igi1/igi1-RNAi mutant. Col-0, igi1/IGI1, igi1/igi1, and igi1/igi1-RNAi (left to right). d Results of real-time PCR of the igi1/igi1-RNAi mutant. Actin was used for normalization and the error bars indicate the standard deviation
Fig. 3
Fig. 3
Expression pattern of the IGI1 gene. ac The expression pattern was detected using a GUS reporter gene under control of the IGI1 gene promoter. ab. Histochemical staining of GUS activity in 5- (a) and 10-day-old (b) seedlings. Expression was detected only in the root hair. c Histochemical staining of GUS activity in each part of a 33-day-old plant. The pictures show the cauline inflorescence and leaf, apical part of main inflorescence, flower, and anther (left to right). GUS expression was weakly detected in the upper stem and immature siliques and strongly detected in the anther of the flowers. d The relative expression levels of the IGI1 gene in different tissues. The flower part has a higher expression level than the other parts. Actin was used for normalization and the error bars indicate the standard deviation
Fig. 4
Fig. 4
Real-time PCR analysis related genes of the pytohormone auxin. The graph shows the relative expression levels of the auxin biosynthesis component (CYP79B2 and CYP79B3), auxin efflux carrier (PIN1), DFL1, auxin induced gene (IAA5), LAX1, LAX3, PID and ARF5. CYP79B2 and CYP79B3 were up-regulated and PIN1 was down-regulated in the igi1 mutants. PCR was conducted using the cDNA of a 25-day-old plant as the template. The actin transcript levels were used for normalization. Error bars indicate the standard deviation. Results are the mean of at least three times. Asterisks indicate values significantly different from the wild type Col-0 (P < 0.05)
Fig. 5
Fig. 5
Effect of auxin and cytokinin on IGI1 gene expression. Untreated 7 day old wild type seedlings were transferred to IAA and BAP treated medium and the seedlings were then used to test the hormone response within 3 h of treatment. There was no change in IGI1 gene expression in response to BAP treatment (d); however, IGI1 gene expression was down-regulated in response to exogenous IAA treatment, regardless of the concentration (a). The IAA5, CYP79B2, and ARR4 genes were used to verify the accuracy of the experimental method (b, c, and e). The actin transcript levels were used for normalization. Error bars indicate the standard deviation. The work was repeated two times with same result. Asterisks indicate values significantly different from the 0 uM (P < 0.05)
Fig. 6
Fig. 6
Real-time PCR analysis related genes involved in branching. The graph shows the relative expression levels of branching control genes. MAX3 and MAX4 were down-regulated in igi1 mutant (c and d). MAX1, MAX2, BRC1 and BRC2 showed no detectable expression levels in igi1 mutants. The PCR reaction was performed using the cDNA of a 25-day-old plant. The actin transcript levels were used for normalization. Error bars indicate the standard deviation. Results are the mean of at least three times. Asterisks indicate values significantly different from the wild type Col-0 (P < 0.05)
Fig. 7
Fig. 7
Predicted amino acid sequence of the IGI1. a Amino acid sequence of IGI1. Prolines are indicated by grey shading and the underlining indicated protein kinase signature. b Domain organization of the PERK1 and IGI1 (PERK12). The PERK1 and IGI1 possessed proline rich, transmembrane and kinase domain

Similar articles

Cited by

References

    1. Aguilar-Martínez JA, Poza-Carrión C, Cubas P. Arabidopsis BRANCHED1 acts as an integrator of branching signals within axillary buds. Plant Cell. 2007;19:458–472. doi: 10.1105/tpc.106.048934. - DOI - PMC - PubMed
    1. Arite T, Iwata H, Ohshima K, Maekawa M, Nakajima M, Kojima M, Sakakibara H, Kyozuka J. DWARF10, an RMS1/MAX4/DAD1 ortholog, controls lateral bud outgrowth in rice. Plant J. 2007;51:1019–1029. doi: 10.1111/j.1365-313X.2007.03210.x. - DOI - PubMed
    1. Bainbridge K, Sorefan K, Ward S, Leyser O. Hormonally controlled expression of the Arabidopsis MAX4 shoot branching regulatory gene. Plant J. 2005;44:569–580. doi: 10.1111/j.1365-313X.2005.02548.x. - DOI - PubMed
    1. Bangerth F. Response of cytokinin concentration in the xylem exudate of bean (Phaseolus vulgaris L.) plants to decapitation and auxin treatment, and relationship to apical dominance. Planta. 1994;194:439–442. doi: 10.1007/BF00197546. - DOI
    1. Bennett T, Sieberer T, Willett B, Booker J, Luschnig C, Leyser O. The Arabidopsis MAX pathway controls shoot branching by regulating auxin transport. Curr Biol. 2006;16:553–563. doi: 10.1016/j.cub.2006.01.058. - DOI - PubMed

Publication types

MeSH terms