

DISCO: distance and spectrum correlation optimization alignment for two-dimensional gas chromatography time-of-flight mass spectrometry-based metabolomics
- PMID: 20476746
- PMCID: PMC2891529
- DOI: 10.1021/ac100064b
DISCO: distance and spectrum correlation optimization alignment for two-dimensional gas chromatography time-of-flight mass spectrometry-based metabolomics
Abstract
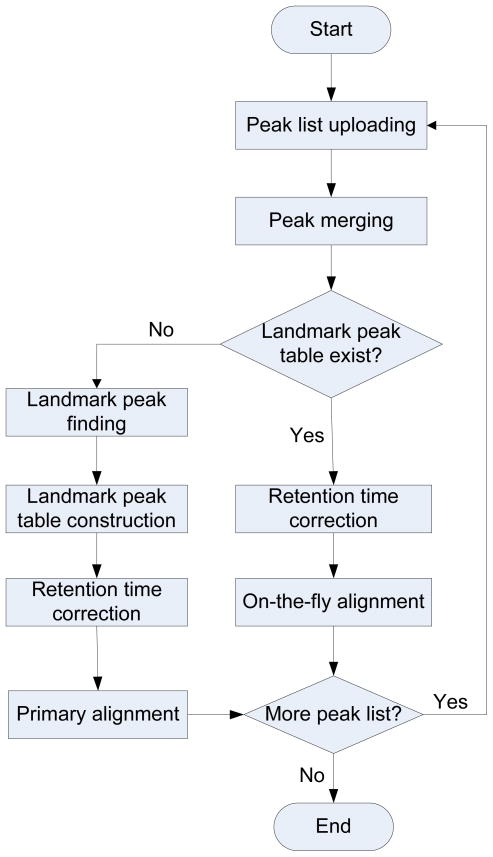
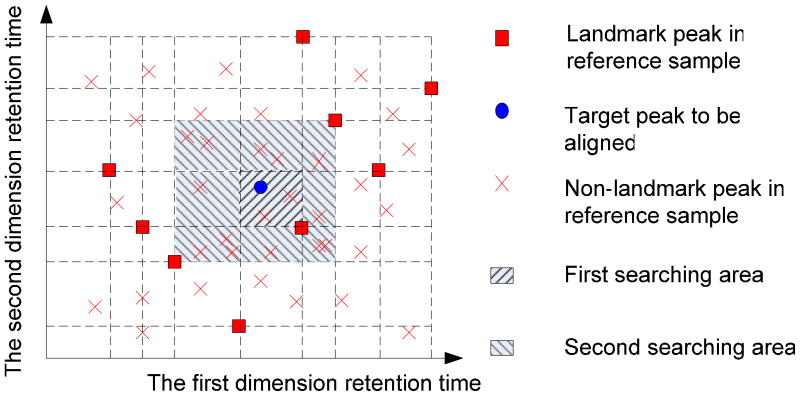
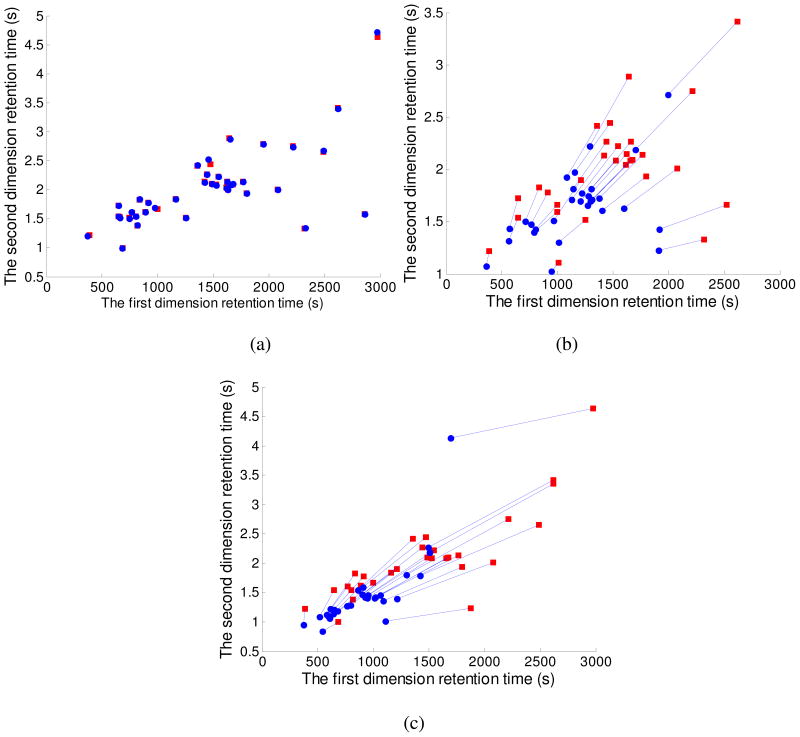
A novel peak alignment algorithm using a distance and spectrum correlation optimization (DISCO) method has been developed for two-dimensional gas chromatography time-of-flight mass spectrometry (GCxGC/TOF-MS)-based metabolomics. This algorithm uses the output of the instrument control software, ChromaTOF, as its input data. It detects and merges multiple peak entries of the same metabolite into one peak entry in each input peak list. After a z-score transformation of metabolite retention times, DISCO selects landmark peaks from all samples based on both two-dimensional retention times and mass spectrum similarity of fragment ions measured by Pearson's correlation coefficient. A local linear fitting method is employed in the original two-dimensional retention time space to correct retention time shifts. A progressive retention time map searching method is used to align metabolite peaks in all samples together based on optimization of the Euclidean distance and mass spectrum similarity. The effectiveness of the DISCO algorithm is demonstrated using data sets acquired under different experiment conditions and a spiked-in experiment.
Figures


Similar articles
-
A Two-stage Peak Alignment Algorithm for Two-Dimensional Gas Chromatography Time-of-Flight Mass Spectrometry-Based Metabolomics.Comput Struct Biotechnol J. 2013 Jun 19;7:e201304002. doi: 10.5936/csbj.201304002. eCollection 2013. Comput Struct Biotechnol J. 2013. PMID: 24688732 Free PMC article.
-
Web Server for Peak Detection, Baseline Correction, and Alignment in Two-Dimensional Gas Chromatography Mass Spectrometry-Based Metabolomics Data.Anal Chem. 2016 Nov 1;88(21):10395-10403. doi: 10.1021/acs.analchem.6b00755. Epub 2016 Oct 13. Anal Chem. 2016. PMID: 27673369
-
Smith-Waterman peak alignment for comprehensive two-dimensional gas chromatography-mass spectrometry.BMC Bioinformatics. 2011 Jun 15;12:235. doi: 10.1186/1471-2105-12-235. BMC Bioinformatics. 2011. PMID: 21676240 Free PMC article.
-
MetPP: a computational platform for comprehensive two-dimensional gas chromatography time-of-flight mass spectrometry-based metabolomics.Bioinformatics. 2013 Jul 15;29(14):1786-92. doi: 10.1093/bioinformatics/btt275. Epub 2013 May 11. Bioinformatics. 2013. PMID: 23665844 Free PMC article.
-
Methods of discovery-based and targeted metabolite analysis by comprehensive two-dimensional gas chromatography with time-of-flight mass spectrometry detection.Methods Mol Biol. 2014;1198:83-97. doi: 10.1007/978-1-4939-1258-2_6. Methods Mol Biol. 2014. PMID: 25270924 Review.
Cited by
-
Comprehensive Two-Dimensional Gas Chromatography Mass Spectrometry-Based Metabolomics.Adv Exp Med Biol. 2021;1280:57-67. doi: 10.1007/978-3-030-51652-9_4. Adv Exp Med Biol. 2021. PMID: 33791974
-
Applications of Mass Spectrometry in the Characterization, Screening, Diagnosis, and Prognosis of COVID-19.Adv Exp Med Biol. 2024;1443:33-61. doi: 10.1007/978-3-031-50624-6_3. Adv Exp Med Biol. 2024. PMID: 38409415
-
Introducing a Cell-Free Approach for the Identification of Brewing Yeast (Saccharomyces cerevisiae) Strains Using MALDI-TOF MS.J Am Soc Mass Spectrom. 2018 Nov;29(11):2248-2259. doi: 10.1007/s13361-018-2031-x. Epub 2018 Aug 7. J Am Soc Mass Spectrom. 2018. PMID: 30088233
-
Comparative analysis of mass spectral similarity measures on peak alignment for comprehensive two-dimensional gas chromatography mass spectrometry.Comput Math Methods Med. 2013;2013:509761. doi: 10.1155/2013/509761. Epub 2013 Sep 16. Comput Math Methods Med. 2013. PMID: 24151524 Free PMC article.
-
Molecular Skin Surface-Based Transformation Visualization between Biological Macromolecules.J Healthc Eng. 2017;2017:4818604. doi: 10.1155/2017/4818604. Epub 2017 Apr 20. J Healthc Eng. 2017. PMID: 29065609 Free PMC article.
References
-
- Imasaka T, Nakamura N, Sakoda Y, Yamaguchi S, Watanabe-Ezoe Y, Uchimura T. Analyst. 2009;134:712–718. - PubMed
-
- Jia L, Liu BF, Terabe S, Nishioka T. Anal Chem. 2004;76:1419–1428. - PubMed
-
- Pierce KM, Hoggard JC, Mohler RE, Synovec RE. J Chromatogr A. 2008;1184:341–352. - PubMed
-
- Bedair M, Sumner LW. Trac-Trends in Analytical Chemistry. 2008;27:238–250.
Publication types
MeSH terms
Grants and funding
LinkOut - more resources
Full Text Sources
Other Literature Sources
