

The mEPN scheme: an intuitive and flexible graphical system for rendering biological pathways
- PMID: 20478018
- PMCID: PMC2878301
- DOI: 10.1186/1752-0509-4-65
The mEPN scheme: an intuitive and flexible graphical system for rendering biological pathways
Abstract
Background: There is general agreement amongst biologists about the need for good pathway diagrams and a need to formalize the way biological pathways are depicted. However, implementing and agreeing how best to do this is currently the subject of some debate.
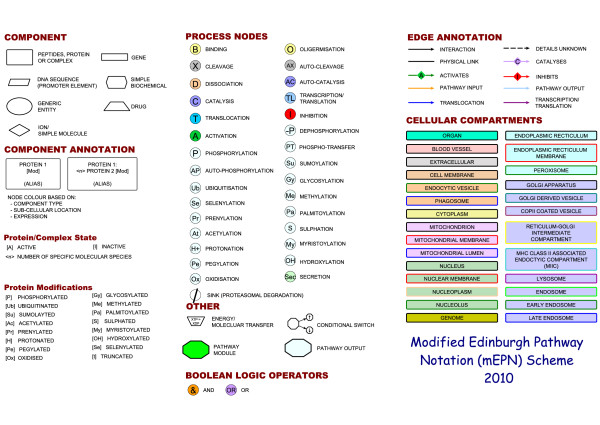
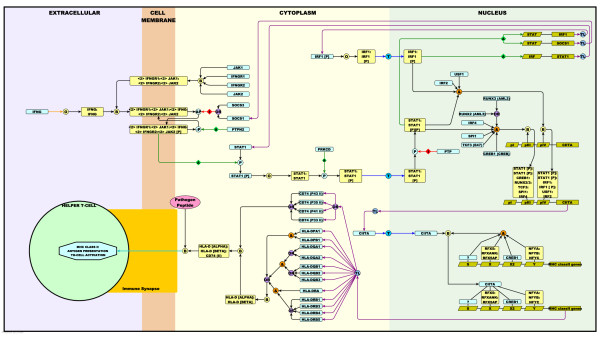
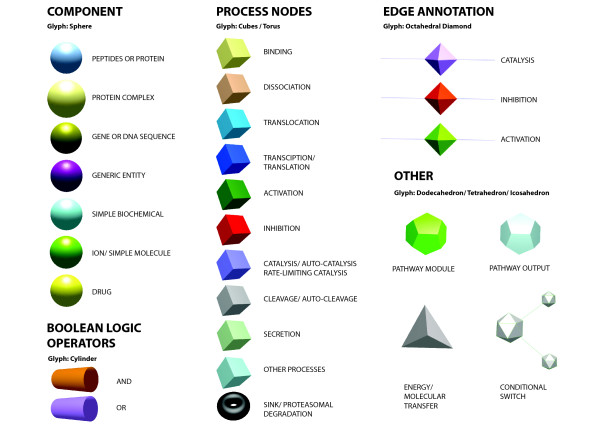
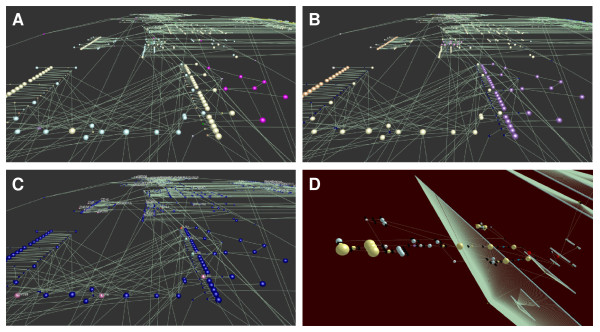
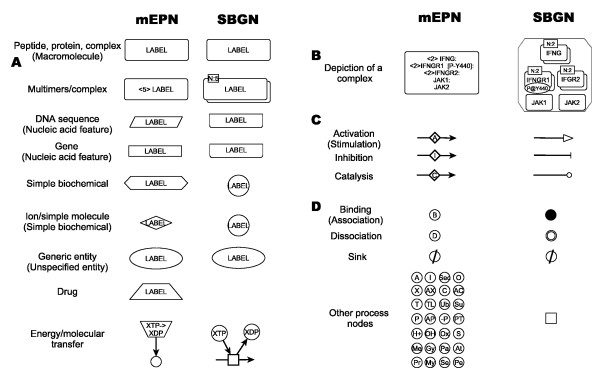
Results: The modified Edinburgh Pathway Notation (mEPN) scheme is founded on a notation system originally devised a number of years ago and through use has now been refined extensively. This process has been primarily driven by the author's attempts to produce process diagrams for a diverse range of biological pathways, particularly with respect to immune signaling in mammals. Here we provide a specification of the mEPN notation, its symbols, rules for its use and a comparison to the proposed Systems Biology Graphical Notation (SBGN) scheme.
Conclusions: We hope this work will contribute to the on-going community effort to develop a standard for depicting pathways and will provide a coherent guide to those planning to construct pathway diagrams of their biological systems of interest.
Figures

Similar articles
-
A graphical and computational modeling platform for biological pathways.Nat Protoc. 2018 Apr;13(4):705-722. doi: 10.1038/nprot.2017.144. Epub 2018 Mar 15. Nat Protoc. 2018. PMID: 29543794
-
Biochemical modeling with Systems Biology Graphical Notation.Drug Discov Today. 2010 May;15(9-10):365-70. doi: 10.1016/j.drudis.2010.02.012. Epub 2010 Mar 6. Drug Discov Today. 2010. PMID: 20211756 Review.
-
Beacon Editor: Capturing Signal Transduction Pathways Using the Systems Biology Graphical Notation Activity Flow Language.J Comput Biol. 2017 Dec;24(12):1226-1229. doi: 10.1089/cmb.2017.0095. Epub 2017 Aug 28. J Comput Biol. 2017. PMID: 28846457
-
Modeling biochemical transformation processes and information processing with Narrator.BMC Bioinformatics. 2007 Mar 27;8:103. doi: 10.1186/1471-2105-8-103. BMC Bioinformatics. 2007. PMID: 17389034 Free PMC article.
-
Depicting combinatorial complexity with the molecular interaction map notation.Mol Syst Biol. 2006;2:51. doi: 10.1038/msb4100088. Epub 2006 Oct 3. Mol Syst Biol. 2006. PMID: 17016517 Free PMC article. Review.
Cited by
-
Converting disease maps into heavyweight ontologies: general methodology and application to Alzheimer's disease.Database (Oxford). 2021 Feb 16;2021:baab004. doi: 10.1093/database/baab004. Database (Oxford). 2021. PMID: 33590873 Free PMC article.
-
Stroma-Derived Connective Tissue Growth Factor Maintains Cell Cycle Progression and Repopulation Activity of Hematopoietic Stem Cells In Vitro.Stem Cell Reports. 2015 Nov 10;5(5):702-715. doi: 10.1016/j.stemcr.2015.09.018. Epub 2015 Oct 29. Stem Cell Reports. 2015. PMID: 26527384 Free PMC article.
-
Construction of a large scale integrated map of macrophage pathogen recognition and effector systems.BMC Syst Biol. 2010 May 14;4:63. doi: 10.1186/1752-0509-4-63. BMC Syst Biol. 2010. PMID: 20470404 Free PMC article.
-
Setting the basis of best practices and standards for curation and annotation of logical models in biology-highlights of the [BC]2 2019 CoLoMoTo/SysMod Workshop.Brief Bioinform. 2021 Mar 22;22(2):1848-1859. doi: 10.1093/bib/bbaa046. Brief Bioinform. 2021. PMID: 32313939 Free PMC article. Review.
-
Visualisation of BioPAX Networks using BioLayout Express (3D).F1000Res. 2014 Oct 20;3:246. doi: 10.12688/f1000research.5499.1. eCollection 2014. F1000Res. 2014. PMID: 25949802 Free PMC article.
References
-
- Thomas PD, Kejariwal A, Campbell MJ, Mi H, Diemer K, Guo N, Ladunga I, Ulitsky-Lazareva B, Muruganujan A, Rabkin S. PANTHER: a browsable database of gene products organized by biological function, using curated protein family and subfamily classification. Nucleic Acids Res. 2003;31:334–341. doi: 10.1093/nar/gkg115. - DOI - PMC - PubMed
Publication types
MeSH terms
Grants and funding
LinkOut - more resources
Full Text Sources
