. 2010 May 17:10:43.
doi: 10.1186/1471-2288-10-43.

Subgroup effects despite homogeneous heterogeneity test results

Affiliations

Subgroup effects despite homogeneous heterogeneity test results

Rolf H H Groenwold et al. BMC Med Res Methodol. .

Abstract

Background: Statistical tests of heterogeneity are very popular in meta-analyses, as heterogeneity might indicate subgroup effects. Lack of demonstrable statistical heterogeneity, however, might obscure clinical heterogeneity, meaning clinically relevant subgroup effects.

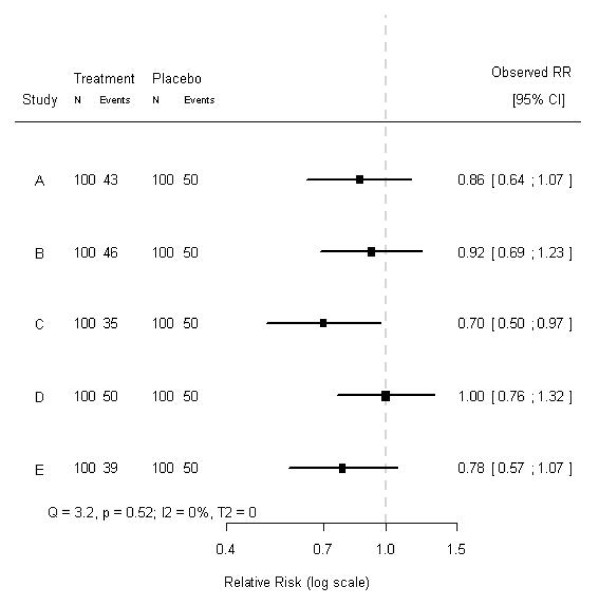
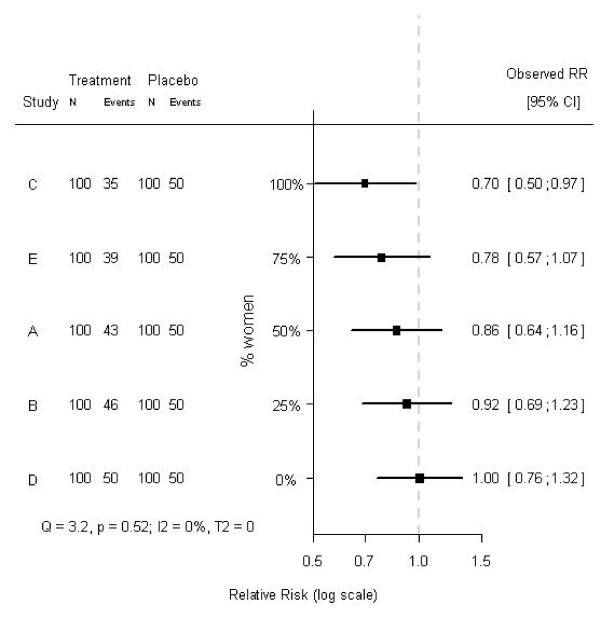
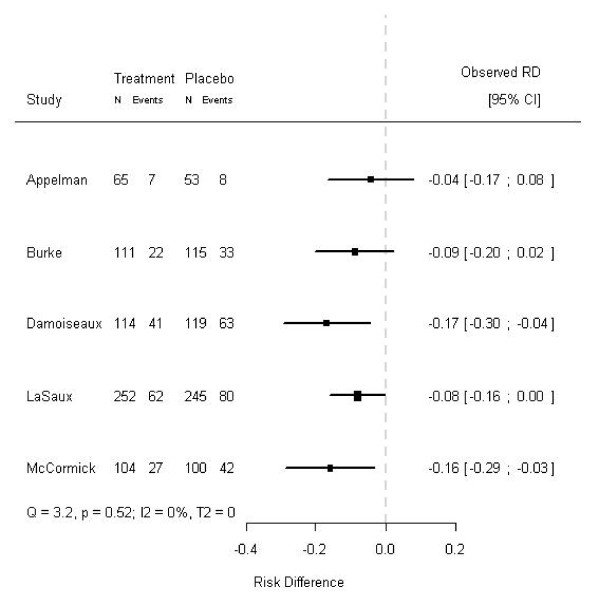
Methods: A qualitative, visual method to explore the potential for subgroup effects was provided by a modification of the forest plot, i.e., adding a vertical axis indicating the proportion of a subgroup variable in the individual trials. Such a plot was used to assess the potential for clinically relevant subgroup effects and was illustrated by a clinical example on the effects of antibiotics in children with acute otitis media.

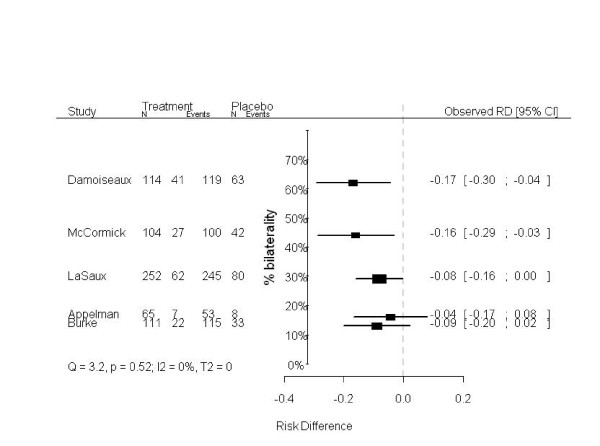
Results: Statistical tests did not indicate heterogeneity in the meta-analysis on the effects of amoxicillin on acute otitis media (Q = 3.29, p = 0.51; I2 = 0%; T2 = 0). Nevertheless, in a modified forest plot, in which the individual trials were ordered by the proportion of children with bilateral otitis, a clear relation between bilaterality and treatment effects was observed (which was also found in an individual patient data meta-analysis of the included trials: p-value for interaction 0.021).

Conclusions: A modification of the forest plot, by including an additional (vertical) axis indicating the proportion of a certain subgroup variable, is a qualitative, visual, and easy-to-interpret method to explore potential subgroup effects in studies included in meta-analyses.


Figures

Figure 1
Figure 1
Forest plot of a hypothetical meta-analysis of five studies. The treatment effects and corresponding 95% confidence intervals of five studies included in a hypothetical meta-analysis are shown. The dashed line (- - - -) indicates no treatment effect. The studies are ordered chronologically.
Figure 2
Figure 2
Modified forest plot of a hypothetical meta-analysis of five studies, ordered by the proportion of women in each study. The treatment effects and corresponding 95% confidence intervals of five studies included in a hypothetical meta-analysis are shown. The dashed line (- - - -) indicates no treatment effect. The studies are ordered by the proportion of women that was included in each study. The studies differ on the proportion of included women (0%, 25%, 50%, 75%, and 100%). The hypothetical treatment is effective in women (RR = 0.7), but not in men (RR = 1.0).
Figure 3
Figure 3
Forest plot of a meta-analysis on five studies on the effects of amoxicillin in children with acute otitis media. The treatment effects and corresponding 95% confidence intervals of five out of six randomized trials included in an IPD meta-analysis on the effects of amoxicillin in children with acute otitis media are shown [13]. The dashed line (- - - -) indicates no treatment effect. The studies are ordered chronologically. In the excluded study, bilaterality was not registered.
Figure 4
Figure 4
Modified forest plot of a meta-analysis on five studies on the effects of amoxicillin in children with acute otitis media, ordered by the proportion of bilateral otitis in each study. The treatment effects and corresponding 95% confidence intervals of five out of six randomized trials included in an IPD meta-analysis on the effects of amoxicillin in children with acute otitis media are shown [13]. The dashed line (- - - -) indicates no treatment effect. The studies are ordered by the proportion of children with bilateral otitis. In the excluded study, bilaterality was not registered.

References

    1. Ioannidis JP. Interpretation of tests of heterogeneity and bias in meta-analysis. J Eval Clin Pract. 2008;14:951–7. - PubMed
    1. Borenstein M, Hedges LV, Higgins JPT, Rothstein HR. Introduction to Meta-analysis. 1. Chichester, UK: John Wiley&Sons; 2009. Identifying and quantifying heterogeneity; pp. 107–26. full_text.
    1. Higgins JPT, Thompson SG. Quantifying heterogeneity in a meta-analysis. Stat Med. 2002;21:1539–58. doi: 10.1002/sim.1186. - DOI - PubMed
    1. Arends LR, Hoes AW, Lubsen J, Grobbee DE, Stijnen T. Baseline risk as a predictor of treatment benefit: three clinical meta-re-analyses. Stat Med. 2000;19:3497–3518. doi: 10.1002/1097-0258(20001230)19:24<3497::AID-SIM830>3.0.CO;2-H. - DOI - PubMed
    1. Cochran WG. Some methods for strengthening the common χ2 tests. Biometrics. 1954;10:417–51. doi: 10.2307/3001616. - DOI

LinkOut - more resources