. 2010 May 17:7:12.
doi: 10.1186/1743-8977-7-12.

Effect of prolonged exposure to diesel engine exhaust on proinflammatory markers in different regions of the rat brain

Affiliations

Effect of prolonged exposure to diesel engine exhaust on proinflammatory markers in different regions of the rat brain

Miriam E Gerlofs-Nijland et al. Part Fibre Toxicol. .

Abstract

Background: The etiology and progression of neurodegenerative disorders depends on the interactions between a variety of factors including: aging, environmental exposures, and genetic susceptibility factors. Enhancement of proinflammatory events appears to be a common link in different neurological impairments, including Alzheimer's disease, Parkinson's disease, amyotrophic lateral sclerosis, and multiple sclerosis. Studies have shown a link between exposure to particulate matter (PM), present in air pollution, and enhancement of central nervous system proinflammatory markers. In the present study, the association between exposure to air pollution (AP), derived from a specific source (diesel engine), and neuroinflammation was investigated. To elucidate whether specific regions of the brain are more susceptible to exposure to diesel-derived AP, various loci of the brain were separately analyzed. Rats were exposed for 6 hrs a day, 5 days a week, for 4 weeks to diesel engine exhaust (DEE) using a nose-only exposure chamber. The day after the final exposure, the brain was dissected into the following regions: cerebellum, frontal cortex, hippocampus, olfactory bulb and tubercles, and the striatum.

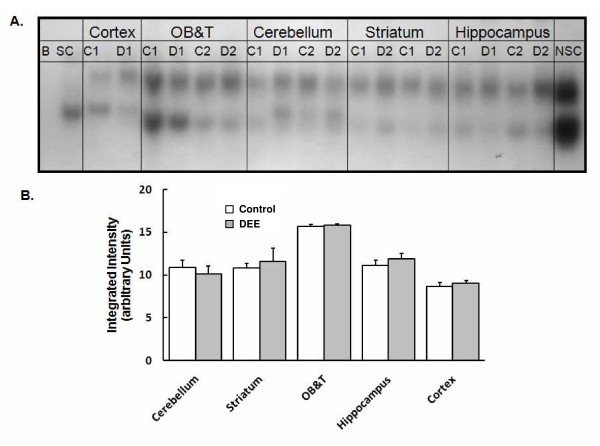
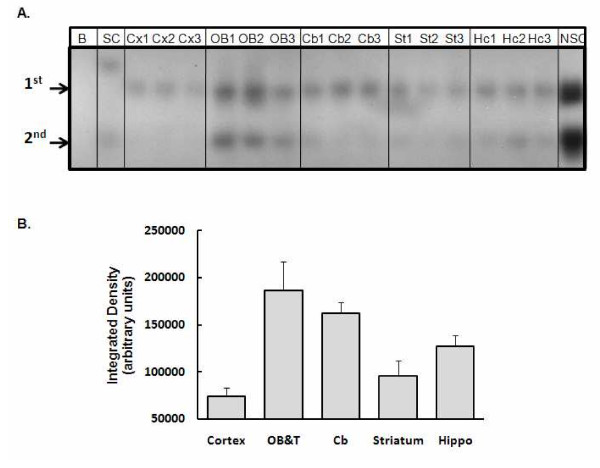
Results: Baseline levels of the pro-inflammatory cytokines tumor necrosis factor alpha (TNF-alpha) and interleukin-1 alpha (IL-1alpha) were dependent on the region analyzed and increased in the striatum after exposure to DEE. In addition, baseline level of activation of the transcription factors (NF-kappaB) and (AP-1) was also region dependent but the levels were not significantly altered after exposure to DEE. A similar, though not significant, trend was seen with the mRNA expression levels of TNF-alpha and TNF Receptor-subtype I (TNF-RI).

Conclusions: Our results indicate that different brain regions may be uniquely responsive to changes induced by exposure to DEE. This study once more underscores the role of neuroinflammation in response to ambient air pollution, however, it is valuable to assess if and to what extent the observed changes may impact the normal function and cellular integrity of unique brain regions.


Figures

Figure 1
Figure 1
Pro-inflammatory cytokine levels. A. Levels of TNF-α in different regions of the rat brain after exposure to filtered air (Control) or DEE (Diesel-exposed). Values given as mean ± SE; n = 5; *p < 0.05 compared to control. OB+T = olfactory bulb and the tubercles. B. Levels of IL-1α in different regions of the rat brain after exposure to purified air (Control) or DEE (Diesel-exposed). Values given as mean ± SE; n = 5; *p < 0.05 compared to control. OB+T = olfactory bulb and the tubercles.
Figure 2
Figure 2
NF-κB activation after DEE exposure. A. A gel demonstrating NF-κB shifted bands. Samples from different brain regions were assayed on the same gel. Based on the competitor reactions, the top band is specific for NF-κB. B = Blank; SC = Specific competitor; NSC = Non-specific competitor; C = nuclear fraction derived from the brain of animals exposed to filtered air; D = nuclear fractions derived from the brain of animals exposed to DEE; the results for two separate animals (designated as 1 or 2) are shown on this gel. B. The sum intensity of NF-κB specific shifted band (first band shown above) in different regions of the rat brain after exposure to purified air (Control) or DEE (Diesel). Each brain region was analyzed on different days on separate gels and therefore this figure does not allow direct comparison between various brain regions. Bars represent mean of 5 individual animals ± SE.
Figure 3
Figure 3
Basal levels of NF-κB activation. A. A typical gel showing the NF-κB specific shifted bands for three separate control samples (designated as 1, 2, or 3). B = Blank; SC = Specific competitor; NSC = Non-specific competitor; Cx = cortex; OB = olfactory bulbs and tubercles; Cb = cerebellum; St = striatum; Hc = hippocampus. All brain regions were analyzed on the same gel and under the same conditions to allow direct comparison between regions. B. The sum intensity of the first shifted band. OB&T = olfactory bulbs and the tubercles; Cb = cerebellum; Hippo = hippocampus.
Figure 4
Figure 4
AP1 activation. A. A typical gel showing the AP-1 specific shifted band for three separate control samples (designated as 1, 2, or 3). B = Blank; SC = Specific competitor; NSC = Non-specific competitor; Cx = cortex; OB = olfactory bulbs and tubercles; Cb = cerebellum; St = striatum; Hc = hippocampus. All brain regions were analyzed on the same gel and under the same conditions to allow direct comparison between regions. B. The sum intensity of the shifted band. OB+T = olfactory bulbs and the tubercles; Cb = cerebellum; Hippo = hippocampus. C. The sum intensity of AP-1 specific shifted band in different regions of the rat brain after exposure to purified air (Control) or DEE (Diesel). Each brain region was analyzed on different days on separate gels and therefore this figure does not allow direct comparison between various brain regions. Bars represent mean of 5 individual animals ± SE.
Figure 5
Figure 5
RNA expression. A. RNA expression for TNF-α. Bars represent mean of 5 individual animals SE. There are no error bars for the cortex of DEE-exposed animals because only one sample was available. B. RNA expression for TNF-RI. Bars represent mean of 5 individual animals ± SE. Bars represent mean of 5 individual animals SE. There are no error bars for the cortex of DEE-exposed animals because only one sample was available.

References

    1. Pope CA, Burnett R, Thun MJ, Calle EE, Krewski D, Ito K, Thurston JD. Lung cancer, cardiopulmonary mortality, and long-term exposure to fine particulate air pollution. JAMA. 2002;287:1132–1141. doi: 10.1001/jama.287.9.1132. - DOI - PMC - PubMed
    1. Donaldson K, Tran L, Jimenez LA, Duffin R, Newby DE, Mills N, MacNee W, Stone V. Combustion-derived nanoparticles: a review of their toxicology following inhalation exposure. Particle Fibre Toxicol. 2005;2:10. doi: 10.1186/1743-8977-2-10. - DOI - PMC - PubMed
    1. Brook RD, Franklin B, Cascio W, Hong Y, Howard G, Lipsett M, Luepker R, Mittleman M, Samet J, Smith S, Tager I. Air pollution and cardiovascular disease. Circulation. 2004;109:2655–2671. doi: 10.1161/01.CIR.0000128587.30041.C8. - DOI - PubMed
    1. Kleinman MT, Araujo JA, Nel A, Sioutas C, Campbell A, Cong PQ, Li H, Bondy SC. Inhaled ultrafine particulate matter affects CNS inflammatory processes and may act via MAP kinase signaling pathways. Toxicology Letters. 2008;178:127–130. doi: 10.1016/j.toxlet.2008.03.001. - DOI - PMC - PubMed
    1. MohanKumar SMJ, Campbell A, Block M, Veronesi B. Particulate matter, oxidative stress and neurotoxocity. Neurotoxicology. 2008;29:479–488. doi: 10.1016/j.neuro.2007.12.004. - DOI - PubMed

Publication types

LinkOut - more resources