. 2010 May 17:9:108.
doi: 10.1186/1476-4598-9-108.

MicroRNA-101 negatively regulates Ezh2 and its expression is modulated by androgen receptor and HIF-1alpha/HIF-1beta

Affiliations

MicroRNA-101 negatively regulates Ezh2 and its expression is modulated by androgen receptor and HIF-1alpha/HIF-1beta

Paul Cao et al. Mol Cancer. .

Abstract

Background: In prostate cancer (PCa), the common treatment involving androgen ablation alleviates the disease temporarily, but results in the recurrence of highly aggressive and androgen-independent metastatic cancer. Therefore, more effective therapeutic approaches are needed. It is known that aberrant epigenetics contributes to prostate malignancy. Unlike genetic changes, these epigenetic alterations are reversible, which makes them attractive targets in PCa therapy to impede cancer progression. As a histone methyltransferase, Ezh2 plays an essential role in epigenetic regulation. Since Ezh2 is overexpressed and acts as an oncogene in PCa, it has been proposed as a bona fide target of PCa therapy. MicroRNAs (miRNAs) regulate gene expression through modulating protein translation. Recently, the contribution of miRNAs in cancer development is increasingly appreciated. In this report, we present our study showing that microRNA-101 (miR-101) inhibits Ezh2 expression and differentially regulates prostate cancer cells. In addition, the expression of miR-101 alters upon androgen treatment and HIF-1alpha/HIF-1beta induction.

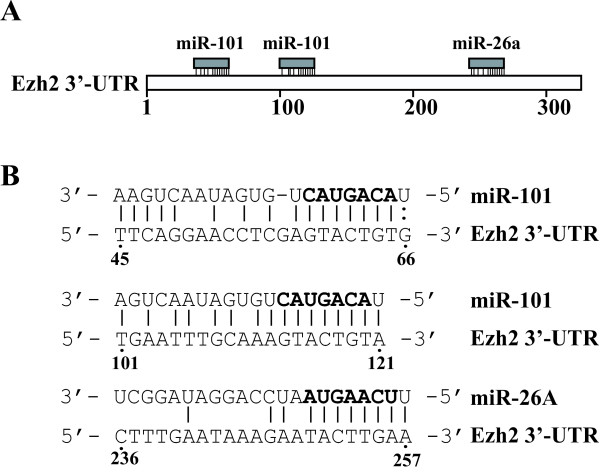
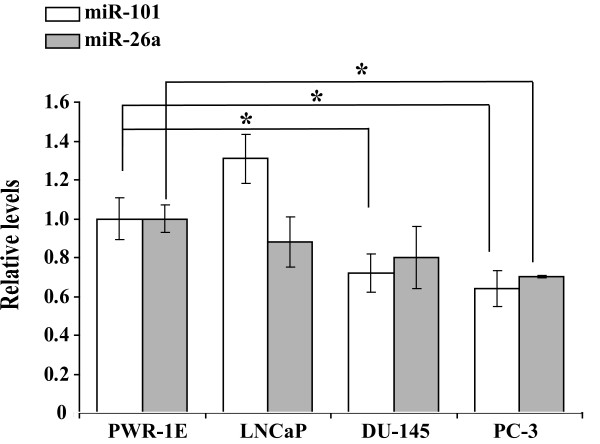
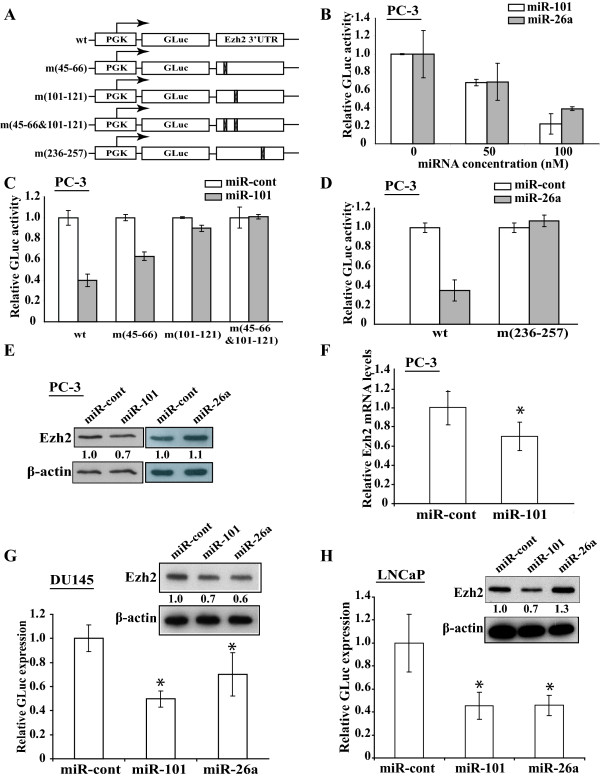
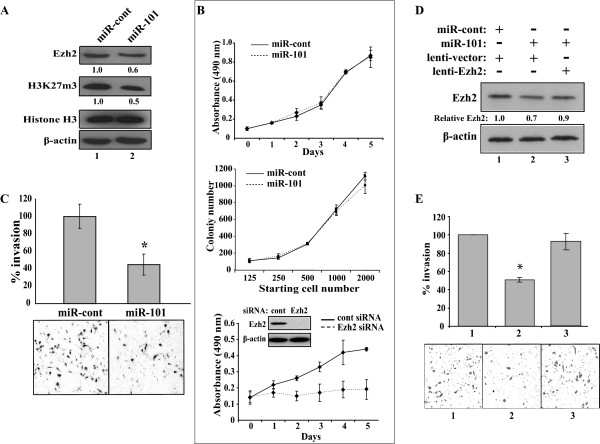
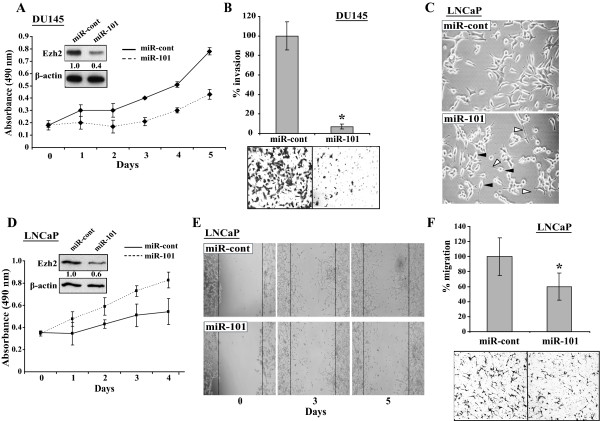
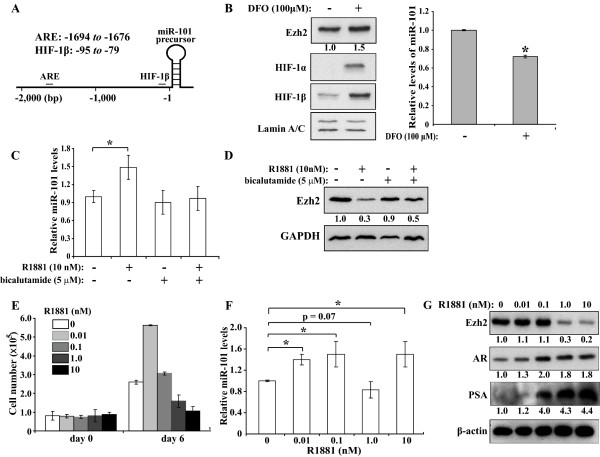
Result: In our reporter assays, both miR-101 and miR-26a inhibit the expression of a reporter construct containing the 3'-UTR of Ezh2. When ectopically expressed in PC-3, DU145 and LNCaP cells, miR-101 inhibits endogenous Ezh2 expression in all three cell lines, while miR-26a only decreases Ezh2 in DU145. Ectopic miR-101 reduces the invasion ability of PC-3 cells, while restored Ezh2 expression rescues the invasiveness of PC-3 cells. Similarly, miR-101 also inhibits cell invasion and migration of DU145 and LNCaP cells, respectively. Interestingly, ectopic miR-101 exhibits differential effects on the proliferation of PC-3, DU-145 and LNCaP cells and also causes morphological changes of LNCaP cells. In addition, the expression of miR-101 is regulated by androgen receptor and HIF-1alpha/HIF-1beta. While HIF-1alpha/HIF-1beta induced by deferoxamine mesylate (DFO) decreases miR-101 levels, the overall effects of R-1881 on miR-101 expression are stimulatory.

Conclusions: This study indicates that miR-101 targets Ezh2 and decreases the invasiveness of PCa cells, suggesting that miR-101 introduction is a potential therapeutic strategy to combat PCa. MiR-101 differentially regulates prostate cell proliferation. Meanwhile, the expression of miR-101 is also modulated at different physiological conditions, such as androgen stimulation and HIF-1alpha/HIF-1beta induction.


Figures

Figure 1
Figure 1
Schematic diagrams of predicted targets of miR-101 and miR-26a in Ezh2 3'-UTR. A. Two predicted miR-101 target sites and one predicted miR-26a target site in the 3'-UTR of Ezh2. The first nucleotide right behind the stop codon of Ezh2 is arbitrarily designated as "1". B. Sequence alignments of miR-101 and miR-26a with their corresponding potential target sites in the 3'-UTR of Ezh2. The seed sequences of the two miRNAs are bolded, and the matched or complementary nucleotides between the miRNAs and the Ezh2 3'-UTR are indicated. The positions of each predicted target on Ezh2 3'-UTR are labeled beneath the alignment.
Figure 2
Figure 2
Analysis of miR-101 and miR-26a expression in prostate cancer cell lines. RT-PCR was conducted using RNAs extracted individually from PWR-1E, LNCaP, DU-145 and PC-3 cells with a stem-loop primer specific to miR-101 or miR-26a. The generated cDNAs were subjected to further analysis by Taqman Real-Time PCR using FAM-labeled miR-101 or miR-26a probes (Applied BioSystems). Each sample was analyzed in triplicates. The data are presented as an average of two experiments and normalized to the expression of the endogenous U6 RNA using the ΔΔCT method [28] as described in Materials and Methods. Student T-test was used to determine statistical significance and the asterisks indicate that the p values are not higher than 0.05.
Figure 3
Figure 3
Analysis of miR-101 and miR-26a on Ezh2 3'-UTR in reporter assay, and endogenous Ezh2 expression. A. In wild type (wt) reporter, a 493-bp fragment containing the last 50 bps of Ezh2 coding region and the first 443 bps of Ezh2 3'-UTR embracing the predicted miR-101 and miR-26a target sites is subcloned downstream of GLuc driven by PGK promoter. The four reporter constructs contain mutations in Ezh2 3'-UTR at miR-101 target sites: m(45-66), m(101-121) and m(45-66&101-121); and at miR-26a target site: m(236-257). B. Increasing miR-101 and miR-26a (0, 50 and 100 nM, compensated with miR-cont to 100 nM, if necessary) were cotransfected with wt reporter presented in "A" and the SEAP-expressing plasmid into PC-3 cells (triplicated). GLuc activity was determined and normalized by SEAP activity (see Materials and Methods for details). C. One hundred nM of miR-cont or miR-101 was cotransfected with 50 ng of the indicated reporter constructs and the SEAP-expressing plasmid. GLuc activity was measured and normalized as described above. D. The experiment was performed as "C" using miR-26a and reporter plasmids as labeled. E. PC-3 cells were transfected with miR-cont, miR-101, or miR-26a (120 nM). Ezh2 and β-actin expression was determined by Western blot. Relative Ezh2 levels normalized by β-actin are indicated. F. Ezh2 mRNA levels (normalized to GAPDH) in microRNA-transfected cells analyzed by Real-Time RT-PCR. The asterisk: p ≤ 0.05. G and H. GLuc activity measurement (triplicated) and Western blot were performed as C, D and E in DU-145 (G) and LNCaP (H) cells.
Figure 4
Figure 4
Effects of ectopically expressed miR-101 on the growth, survivability and invasiveness of PC-3 cells. A. Effect of ectopic miR-101 on histone H3-K27 methylation. PC-3 cells were transfected with miR-cont or miR-101 (120 nM). Aliquots of transfected cells were analyzed by Western blots using the indicated antibodies. Relative protein expression is indicated at the bottom of each image. B. Effects of Ezh2 downregulation on proliferation and colony formation of PC-3 cells. In the top and middle panels, aliquots of transfected PC-3 cells in "A" were studied by WST-1 proliferation assay (top) and clonogenic assay (middle). In the bottom panel, PC-3 cells infected by lentivirus carrying the control and Ezh2 siRNAs were tested by WST-1 assay and Ezh2 knockdown tested by Western blot was indicated. C. Effects of ectopic miR-101 on the invasiveness of PC-3 cells using aliquots of transfected PC-3 cells in A. The asterisk indicates p < 0.05 and representative images are presented. D and E. Effects of restored Ezh2 expression on miR-101 transfected PC-3 cells. In D, PC-3 cells were either infected with lentivirus generated from pSL4 vector or pSL4-Ezh2 as indicated. At 48 h post infection, cells were transfected with 120 nM of miR-cont or miR-101 as labeled. After another 48 h, cells were analyzed by Western blots using the indicated antibodies. In E, aliquots of the infected/transfected PC-3 cells with the corresponding sample numbers (1, 2 and 3) in D were studied by invasion assay. Percent invasion is shown with "*" indicating p < 0.05 and representative images.
Figure 5
Figure 5
Effects of miR-101 on DU-145 and LNCaP cells. A and B. Effects of ectopic miR-101 on the proliferation and invasiveness of DU-145 cells. DU-145 cells were transfected by 120 nM of miR-cont or miR-101 mimics and cells were collected at 72 h post-transfection. Aliquots of the cells of each treatment were studied in triplicates by (A) WST-1 cell proliferation assay and (B) Matrigel invasion assay. Western blot analyses of these transfected cells are shown as an insert of "A" and representative images of invasion assay are also shown in "B" (right panel). C, and D. Effects of ectopic miR-101 on the morphology and proliferation of LNCaP cells. In C, the LNCaP cells at 72 h post transfection were imaged under microscope (20×). The black arrow heads indicate the rounding of the cell body, while the white arrow heads point the extensions of cell cytoplasmic portion. In D, the LNCaP cells were seeded in triplicate at a density of 6000 cells/well in 96-well plates and transfected with 120 nM of miR-cont or miR-101 mimics. Cell proliferation was studied by WST-1 reagent. E. Wound healing assay of LNCaP cells transfected with miRNA mimics (120 nM). Images were captured at the time points as indicated. F. Boyden chamber migration assay of LNCaP cells transfected with miRNA mimics (120 nM). The cell numbers were quantified after crystal violet staining with represented images shown below.
Figure 6
Figure 6
Effects of HIF-1β and AR on miR-101 expression. A. Schematic diagram of HIF-1β and AR binding elements upstream of miR-101 coding region. B. Protein and miR-101 expression of DFO-treated PC-3 cells. Nuclear proteins of PC-3 cells treated with 100 μM DFO or mock were analyzed by Western blot (left panel) and Real-Time RT-PCR (right panel, average of two individual experiments with triplicated samples). C and D. LNCaP cells were treated by R1881 and bicalutamide as indicated and analyzed by (C) Real-Time RT-PCR for miR-101 (average of three individual experiments) and (D) Western blot for Ezh2. E, F and G. Effects of R1881 on cell growth, miR-101 levels and gene expression in LNCaP cells. In E, cells were seeded at 1 × 10⁵ cells/well on 6-well plates in phenol red-free RPMI medium with 1% charcoal-stripped FBS, followed by treatment of 0, 0.01, 0.1, 1.0, and 10 nM of R1881. At days 0 and 6, cells in triplicates were counted. Data are the averages of three or more individual experiments. In F, miR-101 levels in the extracted RNA at day 6 were determined by Real-Time RT-PCR with each sample analyzed in triplicate. Data are the average of four independent experiments. Student t-test was used to determine statistical significance (* indicates p < 0.05). In G, whole cell lysates at day 6 of the treatment were analyzed by Western blot using the antibodies labeled on the left.

Similar articles

Cited by

References

    1. Schuettengruber B, Chourrout D, Vervoort M, Leblanc B, Cavalli G. Genome regulation by polycomb and trithorax proteins. Cell. 2007;128:735–745. doi: 10.1016/j.cell.2007.02.009. - DOI - PubMed
    1. Cao R, Wang L, Wang H, Xia L, Erdjument-Bromage H, Tempst P, Jones RS, Zhang Y. Role of histone H3 lysine 27 methylation in Polycomb-group silencing. Science. 2002;298:1039–1043. doi: 10.1126/science.1076997. - DOI - PubMed
    1. Smith ER, Lee MG, Winter B, Droz NM, Eissenberg JC, Shiekhattar R, Shilatifard A. Drosophila UTX is a histone H3 Lys27 demethylase that colocalizes with the elongating form of RNA polymerase II. Mol Cell Biol. 2008;28:1041–1046. doi: 10.1128/MCB.01504-07. - DOI - PMC - PubMed
    1. Tan J, Yang X, Zhuang L, Jiang X, Chen W, Lee PL, Karuturi RK, Tan PB, Liu ET, Yu Q. Pharmacologic disruption of Polycomb-repressive complex 2-mediated gene repression selectively induces apoptosis in cancer cells. Genes Dev. 2007;21:1050–1063. doi: 10.1101/gad.1524107. - DOI - PMC - PubMed
    1. Wilkinson FH, Park K, Atchison ML. Polycomb recruitment to DNA in vivo by the YY1 REPO domain. Proc Natl Acad Sci USA. 2006;103:19296–19301. doi: 10.1073/pnas.0603564103. - DOI - PMC - PubMed

Publication types

MeSH terms