. 2010 May 14;141(4):692-703.
doi: 10.1016/j.cell.2010.03.037.

The vomeronasal organ mediates interspecies defensive behaviors through detection of protein pheromone homologs

Affiliations

The vomeronasal organ mediates interspecies defensive behaviors through detection of protein pheromone homologs

Fabio Papes et al. Cell. .

Abstract

Potential predators emit uncharacterized chemosignals that warn receiving species of danger. Neurons that sense these stimuli remain unknown. Here we show that detection and processing of fear-evoking odors emitted from cat, rat, and snake require the function of sensory neurons in the vomeronasal organ. To investigate the molecular nature of the sensory cues emitted by predators, we isolated the salient ligands from two species using a combination of innate behavioral assays in naive receiving animals, calcium imaging, and c-Fos induction. Surprisingly, the defensive behavior-promoting activity released by other animals is encoded by species-specific ligands belonging to the major urinary protein (Mup) family, homologs of aggression-promoting mouse pheromones. We show that recombinant Mup proteins are sufficient to activate sensory neurons and initiate defensive behavior similarly to native odors. This co-option of existing sensory mechanisms provides a molecular solution to the difficult problem of evolving a variety of species-specific molecular detectors.


Figures

Figure 1
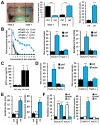
Figure 1. VNO function is necessary for the display of innate behavior induced by predator odors
(A) Left: behavioral arena, odor stimulus is indicated by blue swirls in area 1. Middle: naïve mice are attracted to area 1 containing control odors but avoid cat odors in the same area. Right: quantification of risk-assessment behavior (see Suppl. Exp. Procedures and Video S1 for description of risk assessment behavior and scoring details). (B) TrpC2 function is necessary for the display of risk assessment and avoidance behaviors stimulated by cat odors. (C) Plasma ACTH concentration increases in response to physical restraint (restr) and cat odor but not to control odor eugenol (eug). (D) Risk assessment behavior in TrpC2+/+ and −/− littermates exposed to rat (left) or snake (right) odors. (E) Behavioral outputs in wild-type animals exposed to an ethologically relevant complex stimulus (rabbit urine, white bars). (F) Exposure to the generally aversive odorant naphthalene (NPHT) induces robust avoidance behavior independent of TrpC2 function, and no risk assessment. Black bars in (E) and (F) indicate animals exposed to control odors, blue bars show animals exposed to kairomone odors. n=8-20; *P<0.05; **P<0.01; ***P<0.001; n.s., non-significant; Student’s one-tailed t-test (A, bar graphs in B & D) or ANOVA followed by Tukey-Kramer HSD post-hoc analysis (C, E, F and time course in B). Mean ± SEM. Control odors (ctrl) are PBS-soaked gauze (rat bar graph in D, E, and F) or clean dry gauze (all other panels). See also Fig. S1.
Figure 2
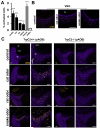
Figure 2. Accessory olfactory system detects and responds to predator odors
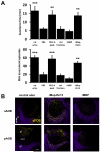
(A) Percent dissociated VNs showing calcium transients following perfusion with complex odors. Mean ± SEM of 1586-4315 sampled neurons (n=7-21 expts). (B) Increase in cFos expression in the VNO of freely moving behaving animals following exposure to control and kairomone odors. (C) TrpC2 function is necessary for cFos induction in the posterior AOB (pAOB) following exposure to kairomone odors (see Fig. S2 for cFos response to predator odors in the anterior part of the AOB). n=8-20; lu, VNO lumen; gr, granule cell layer of the AOB; mcl, mitral cell layer of the AOB; gl, glomerular layer of the AOB; d, dorsal; m, medial; bar=100μm. Blue labeling = nuclear stain, yellow labeling = anti-cFos immunoreactivity. **P<0.01; ***P<0.001; ANOVA followed by Tukey-Kramer HSD post-hoc analysis (A). Mean ± SEM. Control odor in B and C is clean dry gauze.
Figure 3
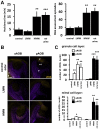
Figure 3. Partial purification of the behavior-inducing kairomone from rat urine by size exclusion fractionation
Size exclusion fractionation of whole male rat urine through an ultrafiltration column yields LMW fraction (molecules smaller than 10kDa), which lacks kairomone activity, and HMW fraction (larger than 10kDa) containing defense promoting bioactivity. (A) Mouse avoidance and risk assessment behavior-inducing activity in rat urine is present in the HMW fraction. (B) HMW fraction induces cFos activity in the AOB. (C) Quantification of cFos positive nuclei in the granule and mitral cell layers of the AOB. White bars = aAOB, black bars = pAOB. Note that the pAOB is almost exclusively activated by HMW fraction, while the LMW fraction mostly activates the anterior AOB. n=8; *P<0.05; **P<0.01; ***P<0.001; ANOVA followed by Tukey-Kramer HSD post-hoc analysis. Mean ± SEM. Control odor is PBS-soaked gauze. See also Fig. S3.
Figure 4
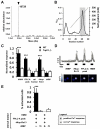
Figure 4. Activation of subsets of vomeronasal sensory neurons by purified putative kairomones
(A) ESI-MS analysis identifying the major protein constituent in the HMW of rat urine (arrowhead). (B) Further fractionation of the HMW by anion exchange FPLC. Fractions from the shaded area were combined to form “FPLC-A peak” and bioactivity was compared to fractions gathered from the non-shaded areas (ctrl fractions). (C) Quantification of response to fractions of rat HMW, recombinant rat Mup13 (rMup-Rn13) and recombinant maltose-binding protein (rMBP) in dissociated VNs isolated from wild-type (black bars) or TrpC2−/− (white bars) male mice and assayed by calcium imaging. The ordinate shows the normalized response compared to the rat HMW activation level. n=4-16 expts; ***P<0.001; ANOVA followed by Tukey-Kramer HSD post-hoc analysis against no stimulus control (0.509% ± 0.177; 0.256 normalized response). (D) Representative calcium transients from 8 isolated VNs, sequentially stimulated with rMBP, rMup-Rn13, the FPLC-A peak, and the HMW fractions of rat urine. Axis bars: X = 60s; Y= 3x(F340/380nm). Images of a representative responding cell are presented below the traces, pseudocolored dark-to-light to indicate calcium influx. (E) Comparative percent activity of dissociated VNs stimulated with rMBP, rMup-Rn13, the FPLC-A peak, and the HMW fraction as assayed by calcium imaging. Each bar denotes the percentage of all imaged cells exhibiting a calcium spike in response to the stimuli marked with a plus sign and not exhibiting a response to the stimuli marked with a minus sign. All cells were exposed to all four stimuli, except for control cells, which were exposed to the indicated number of repetitive pulses of rMBP (white bars). Note the population of cells activated by all three rat stimuli (first bar), which is significantly above the number of cells responding to three pulses of control rMBP (second bar) and no cells responded to rat and rMBP stimuli (third bar). n=10-11; *** P< 0.001; ANOVA followed by Tukey-Kramer HSD post-hoc analysis against respective rMBP control. Mean ± SEM. See also Fig. S4.
Figure 5
Figure 5. Purified inter-species proteins activate the vomeronasal system and induce responses similar to native kairomones
(A) Behavior inducing activity was found in the FPLC-A fraction and is accounted for by recombinant Mup13 (rMup-Rn13). Recombinant maltose-binding protein (rMBP) and control FPLC fractions did not initiate defensive behavior. (B) rMup-Rn13 protein exposure induces AOB activation (see quantification in Fig. S5C). n=8-12; gr, granule cell layer of the AOB; mcl, mitral cell layer of the AOB; gl, glomerular layer of the AOB; d, dorsal; m, medial; bar=100μm. **P<0.01; ***P<0.001; ANOVA followed by Tukey-Kramer HSD post-hoc analysis against PBS-soaked control gauze. Mean ± SEM. See also Fig. S5.
Figure 6
Figure 6. Isolation and characterization of a second purified kairomone
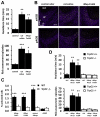
(A) Avoidance and risk assessment behaviors induced by cat saliva kairomones is accounted for by recombinant Mup (rMup-Feld4). (B) cFos immunostaining of the anterior and posterior AOB following exposure to cat saliva and rMup-Feld4. (C) Quantification of calcium imaging to recombinant kairomones, rMup-Rn13 and rMup-Feld4, and recombinant Mup pheromones (a pool of mouse rMup3, 8, 17, 24 and 25, each of which is expressed in C57/BL/6J male urine) in dissociated VNs isolated from wild-type (black bars) or TrpC2−/− (white bars) male mice. Recombinant maltose binding protein (rMBP) is used as a control. n=6-24 expts. (D) Defensive behavior to recombinant Mup protein kairomones depend on VNO function. n=8-12; gr, granule cell layer of the AOB; mcl, mitral cell layer of the AOB; d, dorsal; m, medial; bar=100μm. *P<0.05; **P<0.01; ***P<0.001; ANOVA followed by Tukey-Kramer HSD post-hoc analysis. Mean ± SEM. Control odor is PBS-soaked gauze. See also Fig. S6.
Figure 7
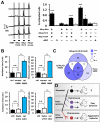
Figure 7. Kairomones and pheromones encode different functions
(A) Left: Representative calcium transients from isolated VNs, sequentially stimulated with recombinant maltose-binding protein (rMBP), rMup-Feld4, rMup-Rn13 and recombinant mouse Mup pheromones (a pool of mouse rMup3, 8, 17, 24 and 25). Axis bars: X = 60s; Y= 3x(F340/380nm). Boxes indicate application and duration of stimulus. Right: comparative percent activity of dissociated VNs stimulated with recombinant rat and cat kairomones and mouse Mups as assayed by calcium imaging. Each bar denotes the percentage of all imaged cells exhibiting a calcium spike in response to the stimuli marked with a plus sign and not exhibiting a response to the stimuli marked with a minus sign. All cells were exposed to all four stimuli, except for control cells, which were exposed to the indicated number of repetitive pulses of rMBP (white bars). Note the presence of populations of cells responsive to kairomones only (fifth bar) and responsive to all Mups (first bar), which are significantly above controls exposed to pulses of rMBP. n=10-11 expts. (B) Avoidance and risk assessment behaviors are triggered only in the presence of the rat-derived HMW fraction (blue bars, top panels) and cat swab (blue bars, bottom panels), inter-species Mups, but not in the presence of C57BL/6 mouse HMW fraction (white bars, top panels) or Swiss strain urine (white bars, bottom panels), which contain mouse Mups. n=11-12. (C) Venn diagram showing populations of cells responsive to kairomones (rMup-Rn13 and rMup-Feld4) and/or Mup-containing HMW fractions from C57BL/6J and Swiss mouse urine, as assayed by calcium imaging (n=10-11 expts; see also Fig. S7E for complete documentation of % activated VNs). Statistical significance of each population (represented by each intersect), against respective rMBP control pulses, is color coded. (D) Model for the proposed co-option of semiochemicals. Left; schematic representation of chronograph of Mup ligand evolution. Center; following stabilization of detection of ancestral ligand, genomic duplication and drift enabled Mups to be detected as kairomones (purple) or pheromones (red). Right; Mups have undergone neofunctionalization to instruct different behaviors. *P<0.05; **P<0.01; ***P<0.001; ANOVA followed by Tukey-Kramer HSD post-hoc analysis. n.s.= non-significant. Mean ± SEM. Control odor (ctrl in B) is PBS-soaked gauze. See also Fig. S7.

Comment in

  • The chemical MUPpeteer.
    Rodriguez I. Rodriguez I. Cell. 2010 May 14;141(4):568-70. doi: 10.1016/j.cell.2010.04.032. Cell. 2010. PMID: 20478249

Similar articles

Cited by

References

    1. Apfelbach R, Blanchard CD, Blanchard RJ, Hayes RA, McGregor IS. The effects of predator odors in mammalian prey species: a review of field and laboratory studies. Neurosci Biobehav Rev. 2005;29:1123–1144. - PubMed
    1. Blanchard DC, Griebel G, Blanchard RJ. Mouse defensive behaviors: pharmacological and behavioral assays for anxiety and panic. Neurosci Biobehav Rev. 2001;25:205–218. - PubMed
    1. Buron G, Hacquemand R, Pourie G, Lucarz A, Jacquot L, Brand G. Comparative behavioral effects between synthetic 2,4,5-trimethylthiazoline (TMT) and the odor of natural fox (Vulpes vulpes) feces in mice. Behav Neurosci. 2007;121:1063–1072. - PubMed
    1. Chamero P, Marton TF, Logan DW, Flanagan K, Cruz JR, Saghatelian A, Cravatt BF, Stowers L. Identification of protein pheromones that promote aggressive behaviour. Nature. 2007;450:899–902. - PubMed
    1. Cheetham SA, Smith AL, Armstrong SD, Beynon RJ, Hurst JL. Limited variation in the major urinary proteins of laboratory mice. Physiol Behav. 2009;96:253–261. - PubMed

Publication types

LinkOut - more resources