

Defining a core set of actin cytoskeletal proteins critical for actin-based motility of Rickettsia
- PMID: 20478540
- PMCID: PMC2935136
- DOI: 10.1016/j.chom.2010.04.008
Defining a core set of actin cytoskeletal proteins critical for actin-based motility of Rickettsia
Abstract
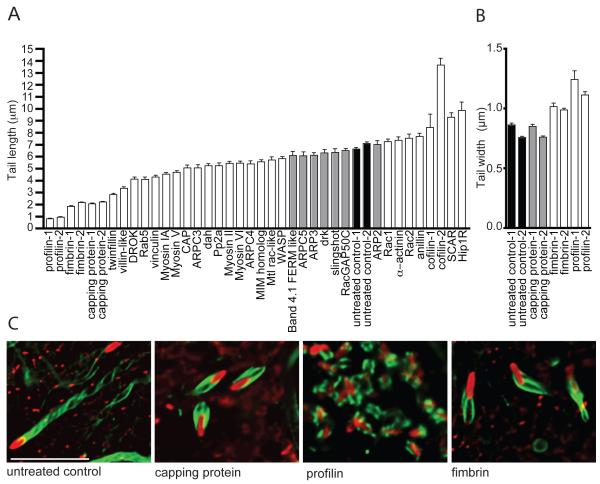
Many Rickettsia species are intracellular bacterial pathogens that use actin-based motility for spread during infection. However, while other bacteria assemble actin tails consisting of branched networks, Rickettsia assemble long parallel actin bundles, suggesting the use of a distinct mechanism for exploiting actin. To identify the underlying mechanisms and host factors involved in Rickettsia parkeri actin-based motility, we performed an RNAi screen targeting 115 actin cytoskeletal genes in Drosophila cells. The screen delineated a set of four core proteins-profilin, fimbrin/T-plastin, capping protein, and cofilin--as crucial for determining actin tail length, organizing filament architecture, and enabling motility. In mammalian cells, these proteins were localized throughout R. parkeri tails, consistent with a role in motility. Profilin and fimbrin/T-plastin were critical for the motility of R. parkeri but not Listeria monocytogenes. Our results highlight key distinctions between the evolutionary strategies and molecular mechanisms employed by bacterial pathogens to assemble and organize actin.
Copyright 2010 Elsevier Inc. All rights reserved.
Figures


Comment in
-
Rickettsia pays the piper; new actors and some bad actin'.Cell Host Microbe. 2010 May 20;7(5):335-6. doi: 10.1016/j.chom.2010.05.003. Cell Host Microbe. 2010. PMID: 20478532
Similar articles
-
The Rickettsia actin-based motility effectors RickA and Sca2 contribute differently to cell-to-cell spread and pathogenicity.mBio. 2025 Feb 5;16(2):e0256324. doi: 10.1128/mbio.02563-24. Epub 2025 Jan 17. mBio. 2025. PMID: 39819005 Free PMC article.
-
Ultrastructure of Rickettsia rickettsii actin tails and localization of cytoskeletal proteins.Infect Immun. 2000 Aug;68(8):4706-13. doi: 10.1128/IAI.68.8.4706-4713.2000. Infect Immun. 2000. PMID: 10899876 Free PMC article.
-
Rickettsia parkeri invasion of diverse host cells involves an Arp2/3 complex, WAVE complex and Rho-family GTPase-dependent pathway.Cell Microbiol. 2012 Apr;14(4):529-45. doi: 10.1111/j.1462-5822.2011.01739.x. Epub 2012 Jan 16. Cell Microbiol. 2012. PMID: 22188208 Free PMC article.
-
Actin-based motility as a self-organized system: mechanism and reconstitution in vitro.C R Biol. 2003 Feb;326(2):161-70. doi: 10.1016/s1631-0691(03)00067-2. C R Biol. 2003. PMID: 12754935 Review.
-
Molecular mechanisms of cell-cell spread of intracellular bacterial pathogens.Open Biol. 2013 Jul 17;3(7):130079. doi: 10.1098/rsob.130079. Open Biol. 2013. PMID: 23864553 Free PMC article. Review.
Cited by
-
High pressure freezing/freeze substitution fixation improves the ultrastructural assessment of Wolbachia endosymbiont-filarial nematode host interaction.PLoS One. 2014 Jan 17;9(1):e86383. doi: 10.1371/journal.pone.0086383. eCollection 2014. PLoS One. 2014. PMID: 24466066 Free PMC article.
-
A Rickettsia genome overrun by mobile genetic elements provides insight into the acquisition of genes characteristic of an obligate intracellular lifestyle.J Bacteriol. 2012 Jan;194(2):376-94. doi: 10.1128/JB.06244-11. Epub 2011 Nov 4. J Bacteriol. 2012. PMID: 22056929 Free PMC article.
-
Capping protein regulatory cycle driven by CARMIL and V-1 may promote actin network assembly at protruding edges.Proc Natl Acad Sci U S A. 2014 May 13;111(19):E1970-9. doi: 10.1073/pnas.1313738111. Epub 2014 Apr 28. Proc Natl Acad Sci U S A. 2014. PMID: 24778263 Free PMC article.
-
MicroRNA Signature of Human Microvascular Endothelium Infected with Rickettsia rickettsii.Int J Mol Sci. 2017 Jul 9;18(7):1471. doi: 10.3390/ijms18071471. Int J Mol Sci. 2017. PMID: 28698491 Free PMC article.
-
The enigmatic biology of rickettsiae: recent advances, open questions and outlook.Pathog Dis. 2021 Apr 9;79(4):ftab019. doi: 10.1093/femspd/ftab019. Pathog Dis. 2021. PMID: 33784388 Free PMC article. Review.
References
-
- Andrianantoandro E, Pollard TD. Mechanism of actin filament turnover by severing and nucleation at different concentrations of ADF/cofilin. Mol. Cell. 2006;24:13–23. - PubMed
-
- Bishop DK, Hinrichs DJ. Adoptive transfer of immunity to Listeria monocytogenes. The influence of in vitro stimulation on lymphocyte subset requirements. J. Immunol. 1987;139:2005–2009. - PubMed
Publication types
MeSH terms
Substances
Grants and funding
LinkOut - more resources
Full Text Sources
Other Literature Sources
Molecular Biology Databases
