. 2010 Sep;136(3):348-63.
doi: 10.1016/j.clim.2010.04.018. Epub 2010 May 15.

Histone/protein deacetylase inhibitors increase suppressive functions of human FOXP3+ Tregs

Affiliations

Histone/protein deacetylase inhibitors increase suppressive functions of human FOXP3+ Tregs

Tatiana Akimova et al. Clin Immunol. 2010 Sep.

Abstract

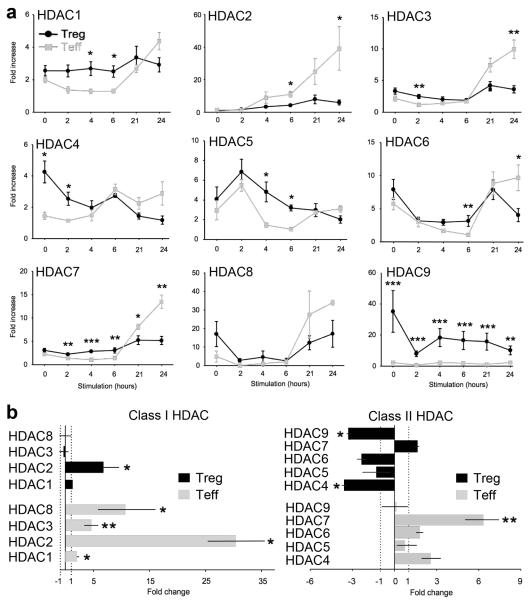
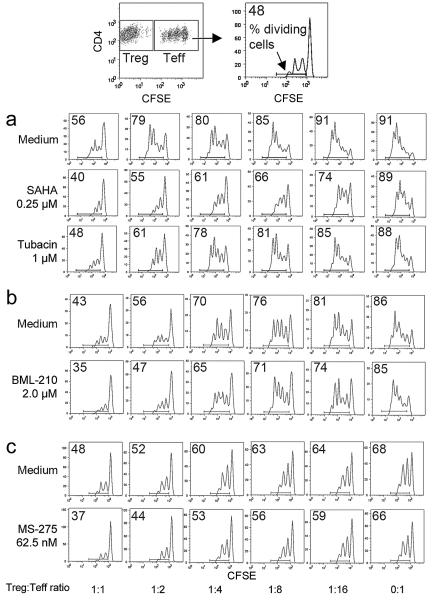
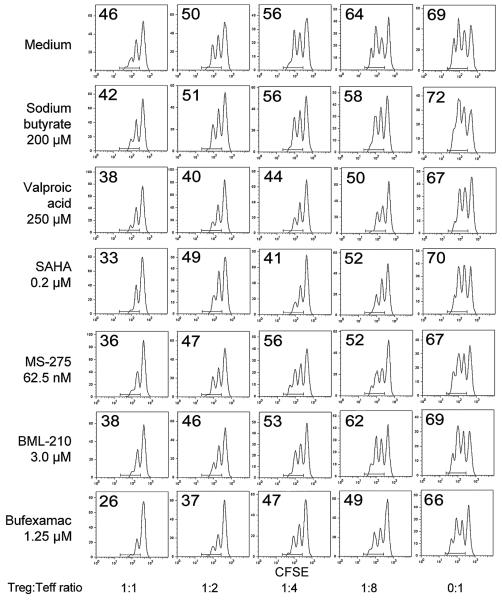
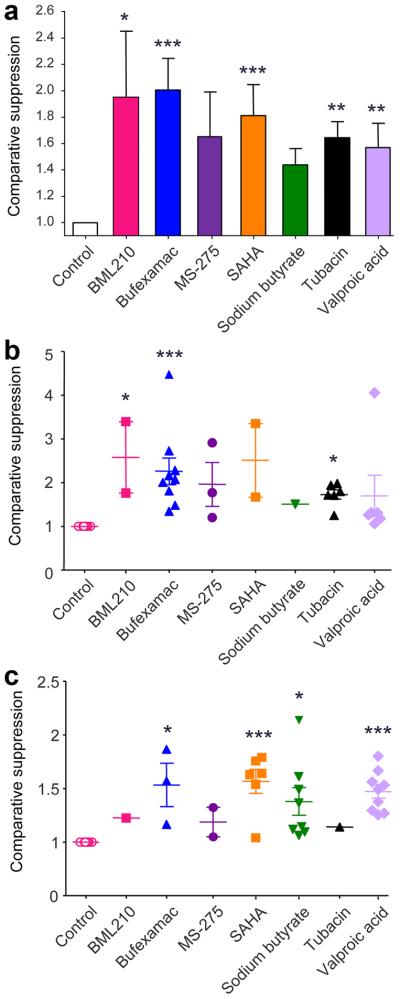
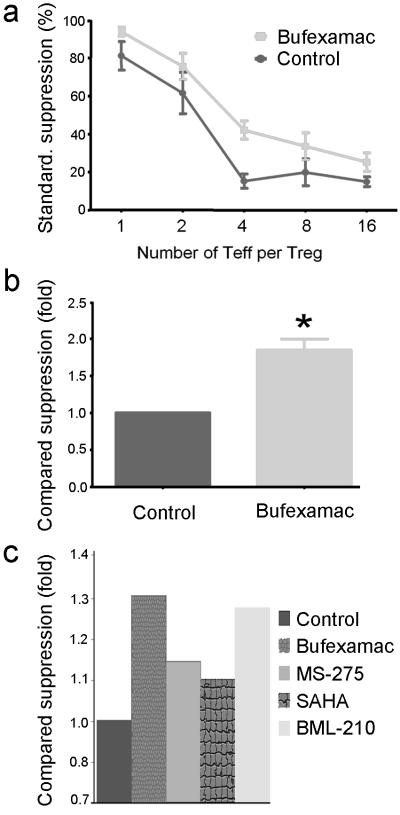
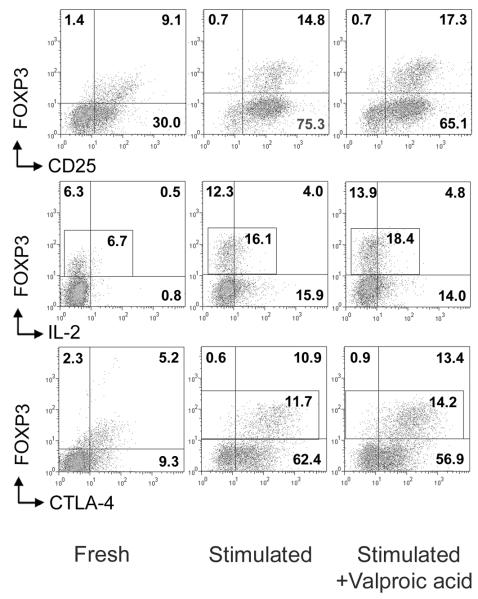
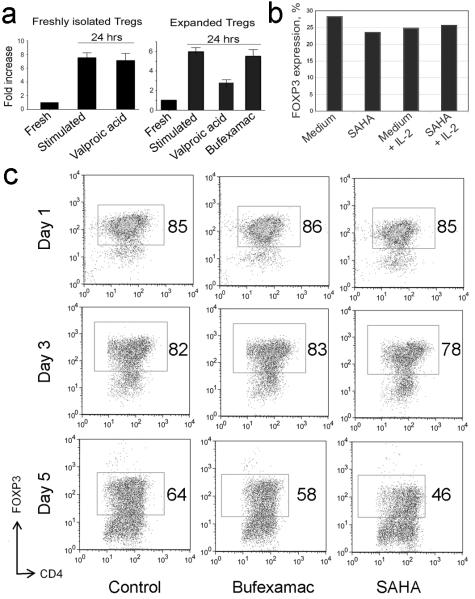
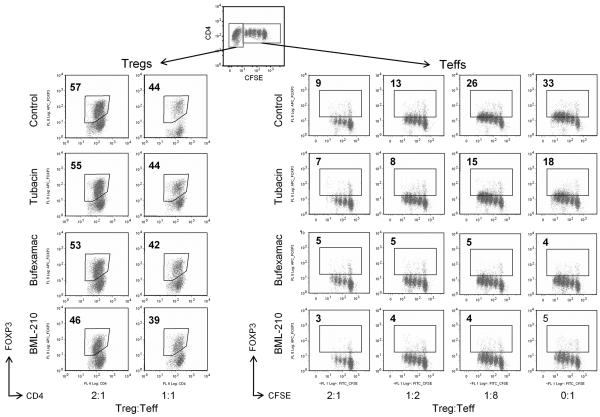
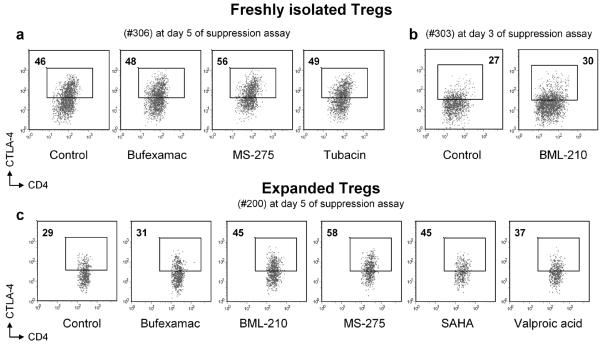
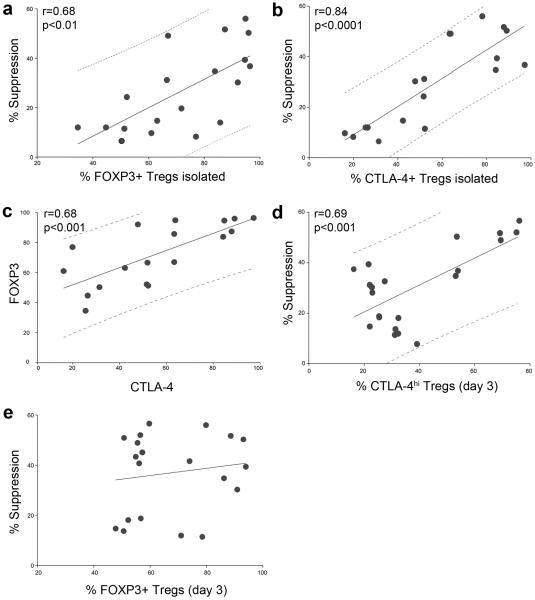
Histone/protein deacetylases (HDACs) decrease histone and protein acetylation, typically leading to suppression of gene transcription and modulation of various protein functions. We found significant differences in expression of HDAC before and after stimulation of human T regulatory (Treg) and T effector cells, suggesting the potential for future selective targeting of Tregs with HDAC inhibitors (HDACi). Use of various HDACi small molecules enhanced, by up to 4.5-fold (average 2-fold), the suppressive functions of both freshly isolated and expanded human Tregs, consistent with our previous murine data. HDACi use increased Treg expression of CTLA-4, a key negative regulator of immune response, and we found a direct and significant correlation between CTLA-4 expression and Treg suppression. Hence, HDACi compounds are promising pharmacologic tools to increase Treg suppressive functions, and this action may potentially be of use in patients with autoimmunity or post-transplantation.


Figures

Figure 1
Figure 1
Serial expression of HDAC mRNA by human Tregs (black) or Teffs (grey) before and after CD3/CD28 stimulation. Freshly isolated CD4+CD25+CD127- Tregs and CD4+CD25- Teffs from the same donor were stimulated for the periods shown and HDAC gene expression determined by qPCR. (a) Relative quantitation was determined separately for each HDAC using a control value of 1, with normalization to 18S rRNA; data (mean ± SEM) are from three male donors. Significant differences in the levels of HDAC mRNA expression in Tregs vs. Teff cells are noted with asterisks (*p<0.05, **p<0.01, ***p<0.001). (b) HDAC mRNA expression in Tregs and Teffs after CD3/CD28 stimulation for 24h compared to unstimulated cells (n=3). Data showing statistical analysis (mean ± SEM) for values for each HDAC at 24 h vs. baseline for the specified cell population (*p<0.05, **p<0.01). The mRNA level of each HDAC after stimulation was divided by the level before stimulation (right x axes), and, in cases of values less than 1, 1/value was performed (left x axes).
Figure 2
Figure 2
Effects of HDACi on suppression assays using freshly isolated Tregs and CFSE-dilution of Teff cells. Top-most panels show how Tregs and Teffs were gated and CFSE peaks evaluated. Assays were performed using concentrations of HDACi that did not affect Teff proliferation directly as determined in preliminary toxicity assays and also monitored in each experiment by assessing Teff proliferation in the absence of added Tregs (0:1 Treg:Teff ratio). The proportion of dividing cells in each well is indicated in the top left of each CFSE-dilution plot; 3 representative experiments (from 29) with cells from different donors and use of (a) SAHA and tubacin, (b) BML-210, and (c) MS-275.
Figure 3
Figure 3
Effects of HDACi on suppression assays using expanded Tregs. Assays were performed in the presence of HDACi concentrations that did not affect Teff proliferation directly as determined in preliminary assays and as monitored in each experiment by assessing Teff proliferation in the absence of added Tregs (0:1 Treg:Teff ratio). The proportion of dividing cells in each well is indicated in the top left of each CFSE-dilution plot. One experiment, representative of 31, is shown.
Figure 4
Figure 4
Comparative suppression of freshly isolated or expanded Treg with HDACi based on data from 60 experiments with cells from 24 donors; all comparisons were determined using Dunn's multiple comparison test (*p<0.05, **p<0.01 and ***p<0.001). (a) Overall pooled data from all assays, with the effect of each drug on suppression of proliferation as compared to control wells receiving medium alone. (b) Data using freshly isolated Tregs plus HDACi and involving 29 experiments with cells from 20 donors. (c) Data using expanded Tregs plus HDACi and involving 31 experiments with cells from 4 donors. For all assays, comparative suppression (mean ± SEM) was calculated as ratio of area under the standardized suppression curves with or without each drug.
Figure 5
Figure 5
Tregs pre-incubated with HDACi showed increased suppressive function. Tregs were incubated with HDACi for 24 h, washed, CFSE-labeled Teffs and APC added, and suppression assays performed as usual over 3 d (see Methods). Upper panel shows standardized suppression curves (a), and compared suppression using area-under-curve ratios (b) for 5 independent experiments with bufexamac (3 donors, p=0.036, Wilcoxon Signed Rank Test). Panel (c) shows data from one experiment with other tested drugs; cumulative difference of HDACi vs control is significant (p=0.025).
Figure 6
Figure 6
FOXP3, CD25, CTLA4 expression and IL-2 production in CD4+ cells after stimulation with or without HDACi. Human PBMC were stimulated for 24 h with CD3/CD28 mAb-coated beads ± addition of HDACi (two experiments with valproic acid and bufexamac were performed). Expression of specified markers as % of positive cells showed for CD4+ gated cells, left column before stimulation, stimulated cells (middle column) and stimulated cells plus valproic acid (right column).
Figure 7
Figure 7
HDACi exposure does not significantly increase expression of FOXP3 in human Tregs, and FOXP3 expression depends upon level of IL-2. (a) qPCR analysis of FOXP3 mRNA in fresh isolated (left) or expanded (middle) Tregs stimulated with CD3/CD28 mAb-coated beads for 24 h in the presence of bufexamac or valproic acid or control (no HDACi). Data of two experiments shown; 5 experiments with cells from 5 donors (4 fresh isolated, 1 expanded Tregs) were obtained with comparable data. (b) Flow cytometric analysis of FOXP3 expression by freshly isolated Tregs that were stimulated with CD3/CD28 mAb-coated beads for 6 h in the presence or absence of human IL-2 (100 U/ml) and SAHA. (c) Flow cytometric analysis of FOXP3 expression by freshly isolated Tregs that were stimulated with CD3/CD28 mAb-coated beads for 1, 3 or 5 d in the presence of bufexamac or SAHA or control (no HDACi); comparable data were seen using expanded Tregs (not shown). Two experiments were performed, and the percentage of FOXP3+ cells is shown in each panel.
Figure 8
Figure 8
Flow cytometry with intranuclear staining for FOXP3 after 3 days of suppression assay. HDACi did not increase FOXP3 expression in either Treg or CFSE-labeled Teff subsets; data are representative of 11 experiments with cells from different donors, freshly isolated as well as expanded Tregs, examined at day 3 or day 5 of suppression assay. Teffs and APC were used in standard Treg suppression assay, followed by intranuclear staining for FOXP3; Tregs were gated according to CD4 and CFSE properties (top panel) and expression of FOXP3 in cells exposed to HDACi was compared with control cells (no HDACi, upper row). Percentages of labeled FOXP3+ Tregs (left panel) and Teffs (right panel) are shown.
Figure 9
Figure 9
All HDACi tested increased CTLA-4 intracellular expression in human Tregs. Flow cytometry of freshly isolated Tregs from two donors (a, b) and expanded (c) Tregs during suppression assays at day 3 (b) or day 5 (a, c). Teffs and APC were used in standard Treg suppression assay, followed by intracellular staining for CTLA-4; Tregs were gated according to CD4 and CFSE properties and expression of CTLA-4hi in cells exposed to HDACi was compared with control cells (no HDACi). Percentages of labeled CTLA-4hi Tregs shown. Data are representative of 10 experiments with cells from different donors, freshly isolated (from 4 donors) as well as expanded (from 2 donors) Tregs, examined at day 3 or day 5 of suppression assay.
Figure 10
Figure 10
Statistical analysis of relationships between Treg suppression and expression of FOXP3 or CTLA-4. Suppression of Teff cell proliferation was calculated as % of divisions of Teffs in wells without Tregs minus % of divisions of Teffs in wells with 1:1 Treg:Teff ratios; Pearson tests with linear regression ± 95% predictive values shown. (a) Correlation of % FOXP3+ cells, isolated with magnetic beads (14 experiments) or expanded (5 experiments) and suppression function; data from 15 donors. (b) Correlation of % CTLA-4+ cells, isolated with magnetic beads (14 experiments) or expanded (4 experiments) and suppression function; data from 14 donors. (c) Correlation of FOXP3+ and CTLA4+ expression in cells isolated with magnetic beads (14 experiments) or expanded (4 experiments); data from 14 donors. (d) Correlation of high CTLA-4 expression by Tregs at day 3 of suppression assay and suppression; data from 10 experiments with 6 donors, with and without HDACi. (e) No correlation of % FOXP3+ cells in Treg subset at day 3 of assay and suppression observed with these cells; data from 11 experiments with 7 donors, with and without HDACi.

Similar articles

Cited by

References

    1. Buckner JH, Ziegler SF. Functional analysis of FOXP3. Ann N Y Acad Sci. 2008;1143:151–69. - PubMed
    1. Shevach EM. Mechanisms of foxp3+ T regulatory cell-mediated suppression. Immunity. 2009;30:636–45. - PubMed
    1. Lu LF, Rudensky A. Molecular orchestration of differentiation and function of regulatory T cells. Genes Dev. 2009;23:1270–82. - PMC - PubMed
    1. Wing K, Sakaguchi S. Regulatory T cells exert checks and balances on self tolerance and autoimmunity. Nat Immunol. 2010;11:7–13. - PubMed
    1. Riley JL, June CH, Blazar BR. Human T regulatory cell therapy: take a billion or so and call me in the morning. Immunity. 2009;30:656–65. - PMC - PubMed

Publication types

MeSH terms