

Multi-year evolutionary dynamics of West Nile virus in suburban Chicago, USA, 2005-2007
- PMID: 20478882
- PMCID: PMC2880109
- DOI: 10.1098/rstb.2010.0054
Multi-year evolutionary dynamics of West Nile virus in suburban Chicago, USA, 2005-2007
Abstract
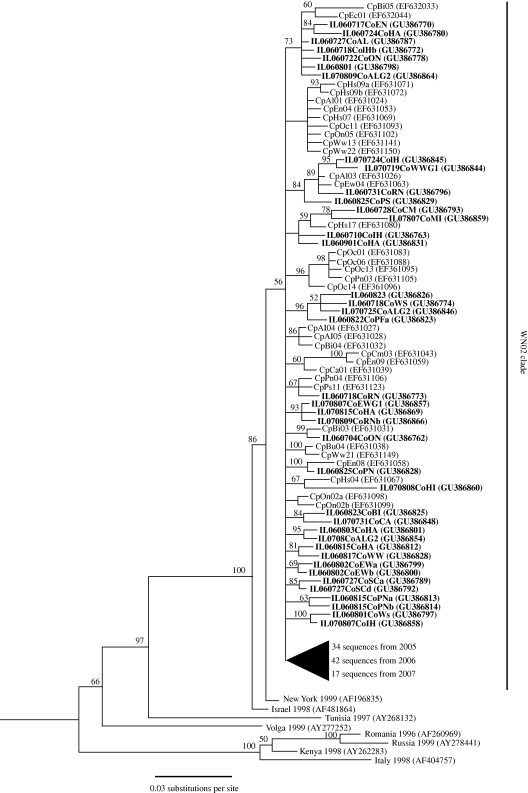
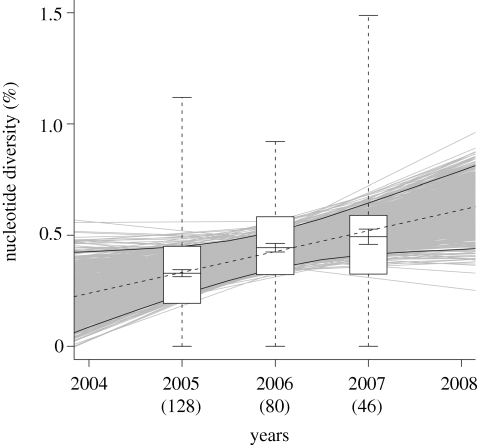
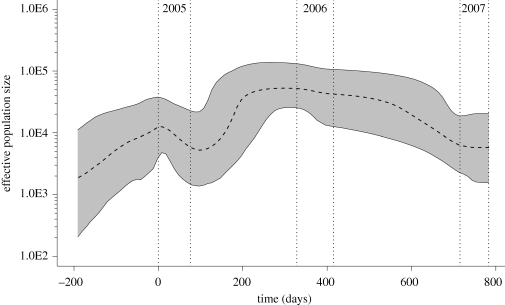
West Nile virus has evolved in concert with its expansion across North America, but little is known about the evolutionary dynamics of the virus on local scales. We analysed viral nucleotide sequences from mosquitoes collected in 2005, 2006, and 2007 from a known transmission 'hot spot' in suburban Chicago, USA. Within this approximately 11 x 14 km area, the viral envelope gene has increased approximately 0.1% yr(-1) in nucleotide-level genetic diversity. In each year, viral diversity was higher in 'residential' sites characterized by dense housing than in more open 'urban green space' sites such as cemeteries and parks. Phylodynamic analyses showed an increase in incidence around 2005, consistent with a higher-than-average peak in mosquito and human infection rates that year. Analyses of times to most recent common ancestor suggest that WNV in 2005 and 2006 may have arisen predominantly from viruses present during 2004 and 2005, respectively, but that WNV in 2007 had an older common ancestor, perhaps indicating a predominantly mixed or exogenous origin. These results show that the population of WNV in suburban Chicago is an admixture of viruses that are both locally derived and introduced from elsewhere, containing evolutionary information aggregated across a breadth of spatial and temporal scales.
Figures
References
-
- Akaike H.1973Maximum likelihood identification of Gaussian autoregressive moving average models. Biometrica 60, 255–265 (doi:10.1093/biomet/60.2.255) - DOI
-
- Andreadis T. G., Thomas M. C., Shepard J. J.2005Identification guide to the mosquitoes of Connecticut. New Haven, CT: The Connecticut Agricultural Experiment Station
-
- Bertolotti L., Kitron U., Goldberg T. L.2007Diversity and evolution of West Nile virus in Illinois and The United States, 2002–2005. Virology 360, 143–149 (doi:10.1016/j.virol.2006.10.030) - DOI - PubMed
-
- Bertolotti L., Kitron U. D., Walker E. D., Ruiz M. O., Brawn J. D., Loss S. R., Hamer G. L., Goldberg T. L.2008Fine-scale genetic variation and evolution of West Nile virus in a transmission ‘hot spot’ in suburban Chicago, USA. Virology 374, 381–389 (doi:10.1016/j.virol.2007.12.040) - DOI - PubMed
-
- Davis C. T., et al. 2005Phylogenetic analysis of North American West Nile virus isolates, 2001–2004: evidence for the emergence of a dominant genotype. Virology 342, 252–265 (doi:10.1016/j.virol.2005.07.022) - DOI - PubMed
Publication types
MeSH terms
Substances
Associated data
- Actions
- Actions
- Actions
- Actions
- Actions
- Actions
- Actions
- Actions
- Actions
- Actions
- Actions
- Actions
- Actions
- Actions
- Actions
- Actions
- Actions
- Actions
- Actions
- Actions
- Actions
- Actions
- Actions
- Actions
- Actions
- Actions
- Actions
- Actions
- Actions
- Actions
- Actions
- Actions
- Actions
- Actions
- Actions
- Actions
- Actions
- Actions
- Actions
- Actions
- Actions
- Actions
- Actions
- Actions
- Actions
- Actions
- Actions
- Actions
- Actions
- Actions
- Actions
- Actions
- Actions
- Actions
- Actions
- Actions
- Actions
- Actions
- Actions
- Actions
- Actions
- Actions
- Actions
- Actions
- Actions
- Actions
- Actions
- Actions
- Actions
- Actions
- Actions
- Actions
- Actions
- Actions
- Actions
- Actions
- Actions
- Actions
- Actions
- Actions
- Actions
- Actions
- Actions
- Actions
- Actions
- Actions
- Actions
- Actions
- Actions
- Actions
- Actions
- Actions
- Actions
- Actions
- Actions
- Actions
- Actions
- Actions
- Actions
- Actions
- Actions
- Actions
- Actions
- Actions
- Actions
- Actions
- Actions
- Actions
- Actions
- Actions
- Actions
- Actions
- Actions
- Actions
- Actions
- Actions
- Actions
- Actions
- Actions
- Actions
- Actions
- Actions
- Actions
- Actions
- Actions
- Actions
LinkOut - more resources
Full Text Sources
Medical