. 2010 Jun 27;365(1548):1879-90.
doi: 10.1098/rstb.2010.0060.

Viral phylodynamics and the search for an 'effective number of infections'

Affiliations

Viral phylodynamics and the search for an 'effective number of infections'

Simon D W Frost et al. Philos Trans R Soc Lond B Biol Sci. .

Abstract

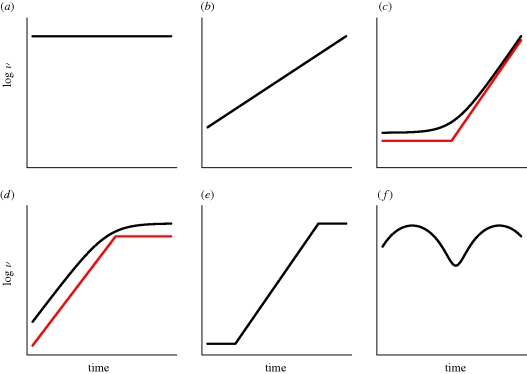
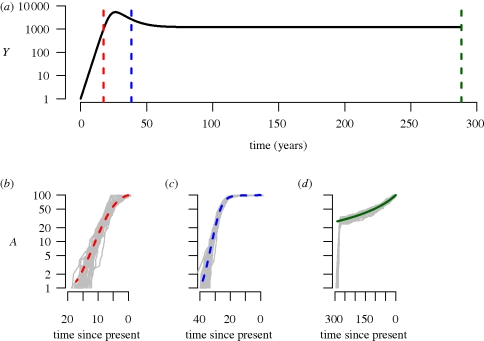
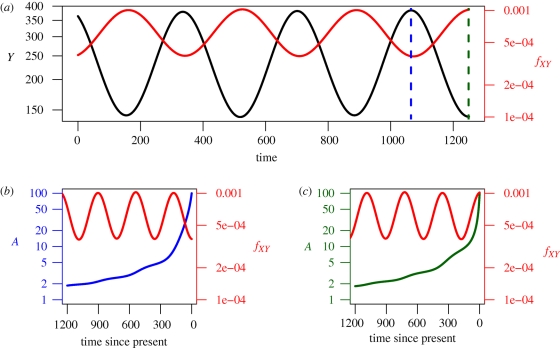
Information on the dynamics of the effective population size over time can be obtained from the analysis of phylogenies, through the application of time-varying coalescent models. This approach has been used to study the dynamics of many different viruses, and has demonstrated a wide variety of patterns, which have been interpreted in the context of changes over time in the 'effective number of infections', a quantity proportional to the number of infected individuals. However, for infectious diseases, the rate of coalescence is driven primarily by new transmissions i.e. the incidence, and only indirectly by the number of infected individuals through sampling effects. Using commonly used epidemiological models, we show that the coalescence rate may indeed reflect the number of infected individuals during the initial phase of exponential growth when time is scaled by infectivity, but in general, a single change in time scale cannot be used to estimate the number of infected individuals. This has important implications when integrating phylogenetic data in the context of other epidemiological data.


Figures

Figure 1.
Figure 1.
Schematic of different phylodynamic patterns for the relative size function, ν over time. (a) constant; (b) exponential; (c) piecewise expansion; (d) piecewise logistic; (e) constant–expansion–constant; (f) oscillatory.
Figure 2.
Figure 2.
Phylodynamics of a simple susceptible-infected model in an open population (equations (2.7) and (2.8) in the main text). (a) Dynamics of the number of infected individuals, I over time in years. The vertical lines denote sampling times, and the number of lineages over time (b) during exponential growth (red), (c) following the peak of infected individuals (blue) and (d) at equilibrium (green). The grey lines represent stochastic simulations; in order to generate a fair comparison between the deterministic model and the stochastic simulations, time was shifted for each simulation such that the peak prevalence occurred at the same time as in the deterministic model. Parameter values are as follows (with time in years); βc = 52, γ = 1/10, μ = 1/70, Λ = 10000/70. The initial conditions were: X(0) = 9999, Y(0) = 1. Sampling times were set at 900/52, 2000/52 and 15000/52 years, and a sample size of 100 was assumed, i.e. A = 100. Numerical simulations were performed in R (R Development Core Team 2009) using the simecol library (Petzoldt & Rinke 2007). Stochastic simulations were performed with SimPy (http://simpy.sourceforge.net). All code is available from S.D.W.F. on request.
Figure 3.
Figure 3.
The product of the transmission probability, contact rate and number of infected individuals, βcY, at different stages of the epidemic depicted in figure 2 (smooth black line) obtained from numerically solving equations (2.7) and (2.8), along with numerical estimates of ‘effective population size’ estimated using generalized skyline plots fitted to stochastic simulations (grey lines) on the same scale. During the exponential growth period, the skyline generates good estimates of βcY. Parameter values and initial conditions are as described in figure 2. Skyline plots were generated using the APE library (Paradis et al. 2004) in R (R Development Core Team 2009). (a) Exponential growth; (b) after peak; (c) at equilibrium.
Figure 4.
Figure 4.
(a) Dynamics of the number of infected individuals, Y, and the transmission rate fXY for a susceptible-infected-recovered model with seasonal forcing, given by equations (2.20)–(2.22) in the main text. Parameter values are as follows (with time in days): β0 = 10/7, β1 = 0.05, ω = 2π/365, γ = 1/7, μ = 1/25550. The population size, N, was assumed to be 106. Initial conditions: S = 100029.946, I = 142.978, R = 899827.076. (b) The time of sampling for the high prevalence scenario was t = 3465, when I = 384.477 (38.4 per 100 000) (c) and the time of sampling for the low prevalence scenario was t = 3649, when I = 140.7068 (14.0 per 100000).

Similar articles

Cited by

References

    1. Amore G., Bertolotti L., Hamer G., Kitron U., Walker E., Ruiz M., Brawn J., Goldberg T.In press Multi-year evolutionary dynamics of West Nile virus 1 in suburban Chicago, USA, 2005–2007. Phil. Trans. R. Soc. Lond. B 365, 1871–1878 (doi:10.1098/rstb.2010.0054) - DOI - PMC - PubMed
    1. Baillie G. J., Kolokotronis S.-O., Waltari E., Maffei J. G., Kramer L. D., Perkins S. L.2008Phylogenetic and evolutionary analyses of St Louis encephalitis virus genomes. Mol. Phylogenet. Evol. 47, 717–728 (doi:10.1016/j.ympev.2008.02.015) - DOI - PubMed
    1. Bello G., Eyer-Silva W. A., Couto-Fernandez J. C., Guimarães M. L., Chequer-Fernandez S. L., Teixeira S. L. M., Morgado M. G.2007Demographic history of HIV-1 subtypes B and F in Brazil. Infect. Genet. Evol., 7, 263–270 (doi:10.1016/j.meegid.2006.11.002) - DOI - PubMed
    1. Bello G., Guimarães M. L., Passaes C. P. B., Almeida S. E. M., Veloso V. G., Morgado M. G.2009Short communication: evidences of recent decline in the expansion rate of the HIV type 1 subtype C and CRF31_BC epidemics in southern Brazil. AIDS Res. Hum. Retroviruses 25, 1065–1069 (doi:10.1089/aid.2009.0106) - DOI - PubMed
    1. Bennett S. N., Drummond A. J., Kapan D. D., Suchard M. A., Muñoz-Jordán J. L., Pybus O. G., Holmes E. C., Gubler D. J.2009Epidemic dynamics revealed in dengue evolution. Mol. Biol. Evol. 27, 811–818 (doi:10.1093/molbev/msp285) - DOI - PMC - PubMed

Publication types