. 2010 May 15;24(10):1045-58.
doi: 10.1101/gad.568810.

Nrf2 establishes a glutathione-mediated gradient of UVB cytoprotection in the epidermis

Affiliations

Nrf2 establishes a glutathione-mediated gradient of UVB cytoprotection in the epidermis

Matthias Schäfer et al. Genes Dev. .

Abstract

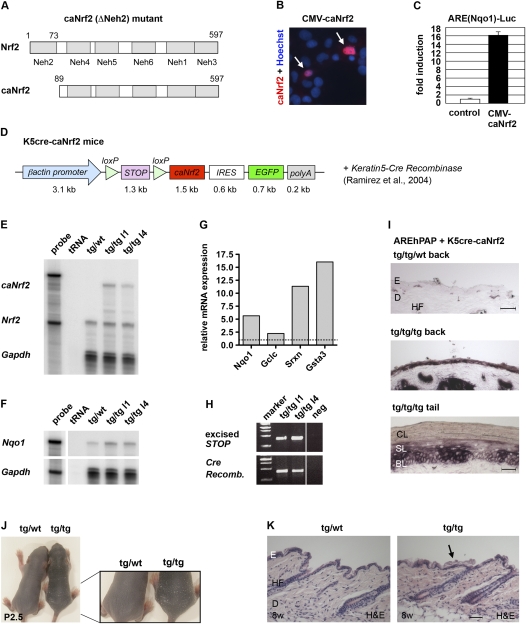
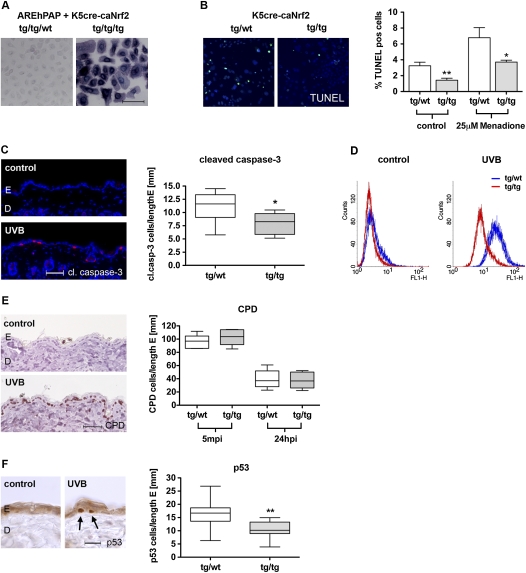
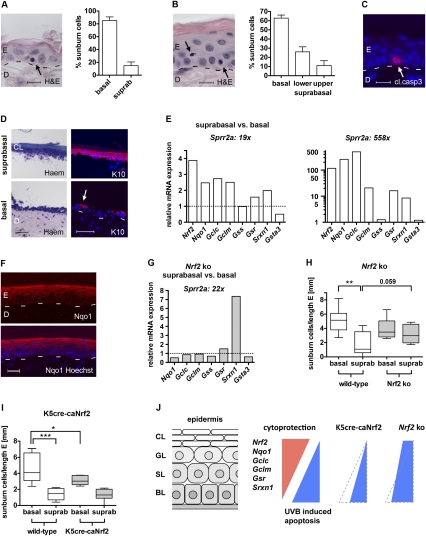
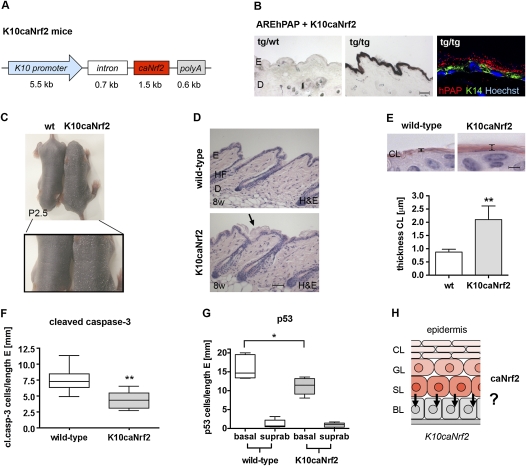
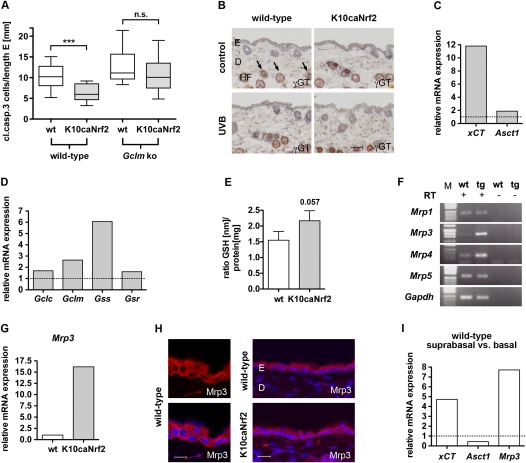
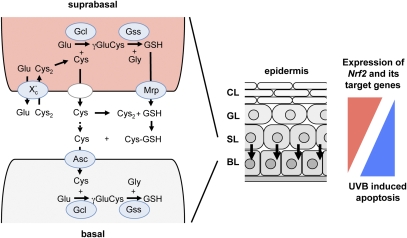
Ultraviolet (UV) B irradiation can severely damage the skin and even induce tumorigenesis. It exerts its effects by direct DNA modification and by formation of reactive oxygen species (ROS). We developed a strategy to genetically activate target gene expression of the transcription factor NF-E2-related factor 2 (Nrf2) in keratinocytes in vivo based on expression of a constitutively active Nrf2 mutant. Activation of Nrf2 target genes strongly reduced UVB cytotoxicity through enhancement of ROS detoxification. Remarkably, the protective effect was extended to neighboring cells. Using different combinations of genetically modified mice, we demonstrate that Nrf2 activates the production, recycling, and release of glutathione and cysteine by suprabasal keratinocytes, resulting in protection of basal cells in a paracrine, glutathione/cysteine-dependent manner. Most importantly, we found that endogenous Nrf2 controls selective protection of suprabasal keratinocytes from UVB-induced apoptosis through activation of cytoprotective genes. This finding explains the preferential UVB-induced apoptosis of basal cells, which is important for elimination of mutated stem cells as well as for preservation of skin integrity. Taken together, our results identify Nrf2 as a key regulator in the UV response of the skin.


Figures

Figure 1.
Figure 1.
Generation of K5cre-caNrf2 transgenic mice. (A) Functional domains of Nrf2 and caNrf2 (ΔNeh2 mutant). (B) Immunofluorescence staining for Nrf2 in COS-1 cells transfected with a CMV-caNrf2 plasmid. Arrows point to nuclear caNrf2. (C) Luciferase reporter assay with a CMV-caNrf2 vector. The control is set to 1. (D) Scheme of the transgene used for generation of K5cre-caNrf2 mice. (E,F) RPA for caNrf2/Nrf2 (E) and Nqo1 (F) using RNAs from skin of transgenic/wild-type (tg/wt) and transgenic/transgenic (tg/tg) mice of lines 1 and 4. tRNA served as negative control (labeled “tRNA”); 104 counts per minute (cpm) of the hybridization probes were used as marker (labeled “probe”). Note up-regulation of Nqo1 proportional to the caNrf2 expression level. (G) qRT–PCR of the Nrf2 target genes Nqo1, Gclc, Srxn1, and Gsta3 using epidermal RNAs of tg/tg and tg/wild-type mice (set to 1). (H) PCR amplification of the STOP cassette (424 bp, top lane) and the Cre recombinase cDNA (419 bp, bottom lane) using DNA from mice of transgenic lines 1 and 4. (I) Staining for hPAP activity in back skin of double-transgenic AREhPAP/K5cre mice (tg/tg/wt) (top panel) and triple-transgenic AREhPAP/K5cre-caNrf2 mice (tg/tg/tg) (middle panel), and tail skin of triple-transgenic AREhPAP/K5cre-caNrf2 mice (tg/tg/tg) (bottom panel). Bars: top panel, 50 μm; bottom panel, 30 μm. (J) P2.5 tg/wild-type and tg/tg K5cre-caNrf2 mice in overview (left picture) and close-up (right picture) of lower back. Note enhanced scaling in tg/tg mice. (K) Longitudinal sections of back skin of 8-wk-old (8w) tg/wild-type and tg/tg mice. The arrow points to the area with the thicker cornified layer. Bar, 100 μm. (BL) Basal layer; (CL) cornified layer; (D) dermis; (E) epidermis; (HF) hair follicle; (SL) suprabasal layer.
Figure 2.
Figure 2.
ROS detoxification and protection from UVB-induced apoptosis in K5cre-caNrf2 transgenic mice. (A) hPAP activity in primary keratinocytes of double-transgenic AREhPAP/K5cre mice (tg/tg/wt) and triple-transgenic AREhPAP/K5cre-caNrf2 mice (tg/tg/tg). Bar, 100 μm. (B, left panel) TUNEL staining of primary keratinocytes (green), nuclei of tg/wild-type mice (left), and tg/tg K5cre-caNrf2 mice (right) stained with Hoechst (blue). (Right graph) Percentage of TUNEL-positive keratinocytes of tg/wild-type and tg/tg mice without (control) (P = 0.0012) and after 8 h of treatment with 25 μM menadione (P = 0.0350). (C, left) Immunofluorescence for cleaved caspase-3 (red), counterstained with Hoechst (blue), in nonirradiated (control) skin and in UVB-irradiated back skin (UVB) (24 hpi, 100 mJ/cm2) of wild-type mice. Bar, 50 μm. (Right) Number of cleaved caspase-3-positive cells per length epidermis in tg/wild-type and tg/tg mice, 24 hpi, 100 mJ/cm2 UVB (N = 9, P = 0.019). (D) FACS analysis of DCF in control (nonirradiated) and 20 mJ/cm2 UVB-irradiated immortalized keratinocytes of tg/wild-type (blue) and tg/tg (red) K5cre-caNrf2 mice. (E, left) Staining for CPD-positive cells in the epidermis of nonirradiated (control) and UVB-irradiated (UVB) wild-type mice. Bar, 50 μm. (Right) CPD-positive cells per length epidermis, 5 min (left side) and 24 hpi (right side) with 100 mJ/cm2 UVB in tg/wild-type and tg/tg K5cre-caNrf2 transgenic mice (N = 6). (F, left) Staining for p53-positive cells in the epidermis of nonirradiated (control) and UVB-irradiated (UVB) wild-type mice. Bar, 25 μm. (Right) p53-positive cells per length epidermis in tg/wild-type and tg/tg K5cre-caNrf2 transgenic mice, 24 hpi, 100 mJ/cm2 UVB (N = 11, P = 0.0039).
Figure 3.
Figure 3.
UVB-induced apoptosis and Nrf2-mediated cytoprotection in the murine epidermis. (A,B, left) H&E staining of wild-type mouse back skin (A) and tail skin (B), 24 hpi, 100 mJ/cm2 UVB. Arrows point to sunburn cells in the basal (A,B) and lower suprabasal (B) layers. Bars: A,B, 10 μm. (Right side) Distribution of sunburn cells in back skin (A) (N = 11) and tail skin (B) (N = 6) epidermis in percent. (C) Cleaved caspase-3 staining of wild-type mouse tail skin, 24 hpi, 100 mJ/cm2 UVB. The arrow points to a positive keratinocyte. Bar, 15 μm. (D) Tail skin after chymotrypsin treatment stained with rapid differential hematology staining (Haem, left panel) or immunostained for K10 (red), costained with Hoechst (blue) (right panel). (Top picture) Suprabasal layers. (Bottom picture) Basal layer and dermis. The arrow points to remaining K10-positive suprabasal keratinocytes. Bars, 50 μm. (E) Nrf2, Nqo1, Gclc, Gclm, Gss, Gsr, Srxn1, and Gsta3 expression in suprabasal relative to basal keratinocytes of tail epidermis from wild-type mice shown for two different separations, analyzed by qRT–PCR. Expression levels in basal keratinocytes were set to 1, indicated by dashed line. (F) Immunofluorescence analysis of Nqo1 (red) in tail skin, costained with Hoechst (blue). Note the staining gradient from basal to suprabasal. Bar, 25 μm. (G) Nqo1, Gclc, Gclm, Gss, Gsr, Srxn1, and Gsta3 expression in suprabasal relative to basal keratinocytes of tail epidermis from Nrf2 knockout (ko) mice, analyzed by qRT–PCR. Note reduced expression of Nqo1, Gclc, Gclm, and Gsr, but elevated expression of Srxn1 in Nrf2 knockout compared with wild-type mice (left graph in E). (H,I) Distribution of sunburn cells per length epidermis in Nrf2 knockout mice (H) (N = 8/9) and K5cre-caNrf2 mice (I) (N = 8) in back skin epidermis, 24 hpi with 100 mJ/cm2 UVB. Note the significant difference between basal and suprabasal keratinocytes in wild-type mice (P = 0.0012 for H; P = 0.0002 for I), the strong increase in suprabasal sunburn cells (P = 0.059) but the slight decrease in basal sunburn cells in Nrf2 knockout mice (H), and the strong decrease in basal sunburn cells in K5cre-caNrf2 mice (I) (P = 0.0499). (J) Scheme demonstrating the gradient of ROS detoxification and UVB-induced apoptosis in wild-type and Nrf2 mutant mice. In wild-type mice, suprabasal keratinocytes express higher levels of Nrf2 and its cytoprotective target genes compared with basal keratinocytes. This results in preferential UVB-induced apoptosis of basal cells. In K5cre-caNrf2 transgenic mice, basal cells are protected from apoptosis, resulting in reduced numbers of mainly basal apoptotic cells and reduction of the apoptotic gradient. In Nrf2 knockout mice, the gradient is also abolished, mainly due to strongly enhanced apoptosis of suprabasal cells but slightly reduced apoptosis of basal cells. (BL) Basal layer; (SL) spinous layer; (GL) granular layer; (CL) cornified layer.
Figure 4.
Figure 4.
Generation of K10caNrf2 transgenic mice and protection from UVB-induced apoptosis. (A) Scheme of the transgene used for generation of transgenic mice. (B) NBT/BCIP staining for hPAP activity in back skin of AREhPAP transgenic mice (left panel) and AREhPAP/K10caNrf2 double-transgenic mice (middle panel). Bar, 50 μm. (Right panel) Fluorescence staining for hPAP activity (red), immunofluorescence for K14 (green), and counterstaining with Hoechst (blue) on back skin sections of AREhPAP/K10caNrf2 mice. Note nonoverlapping localization of hPAP staining in suprabasal and K14 staining in basal keratinocytes. (C) Wild-type (wt) and K10caNrf2 transgenic mice at P2.5 in overview (top picture) and close-up (bottom picture) of lower back. Note enhanced scaling in K10caNrf2 mice. (D) Longitudinal back skin sections of wild-type (wt) and K10caNrf2 (tg) mice at 8 wk (8w). The arrow points to the area with the thicker cornified layer. Bar, 100 μm. (E, top panel) H&E staining of 2-μm sections of skin from wild-type and K10caNrf2 mice. Bar, 2 μm. (Graph) Morphometric measurement of the thickness of the cornified layer (N = 5, P = 0.0025). (F) Number of cleaved caspase-3-positive cells per length epidermis in 8- to 10-wk wild-type and K10caNrf2 mice, 24 hpi, 100 mJ/cm2 UVB (N = 8, P = 0.003). (G) Position of p53-positive keratinocytes per length epidermis in 8- to 10-wk wild-type (left) and K10caNrf2 mice (right) (N = 5, P = 0.0317). (H) Scheme of caNrf2 expression in the epidermis of K10caNrf2 mice and proposed paracrine cytoprotection of basal keratinocytes by suprabasal keratinocytes, indicated by arrows.
Figure 5.
Figure 5.
GSH metabolism in K10caNrf2 transgenic mice. (A) Cleaved caspase-3-positive cells per length epidermis, 24 hpi, 100 mJ/cm2 in wild-type and K10caNrf2 transgenic mice crossed with wild-type (left) (N = 15, P = 0.0003) and Gclm knockout (right) mice (N = 14, P = 0.23). (B) γGT activity staining (auburn) in back skin of wild-type and tg mice, nonirradiated (control) and 24 hpi, 100 mJ/cm2 UVB-irradiated (UVB) mice. Arrows point to staining in lower hair follicle (HF). No staining is visible in the interfollicular epidermis. Bar, 50 μm. (C) qRT–PCR of xCT and Asct1 in epidermis of tg versus wild-type mice (set to 1, indicated by dashed line). (D) qRT–PCR analysis of Gclc, Gclm, Gss, and Gsr using RNAs from epidermis of wild-type and tg mice. The expression level in wild-type mice was set to 1, indicated by dashed line. The qRT–PCR data shown in C and D were obtained from pooled epidermal samples, and were reproduced with a different set of RNAs from different pools of mice. (E) GSH levels normalized to total protein in keratinocytes of wild-type and tg mice (N = 5, P = 0.0571). (F) RT–PCR of Mrp1, Mrp3, Mrp4, Mrp5 in wild-type epidermis with (+) and without (−) RT. (G) qRT–PCR of Mrp3 in wild-type and tg mice. (H) Immunofluorescence analysis of Mrp3 (red), counterstained with Hoechst (blue) in wild-type and tg mouse back skin. Bars: left panel, 15 μm; right panel, 30 μm. (I) xCT, Asct1, and Mrp3 expression in suprabasal relative to basal keratinocytes of wild-type mouse tail epidermis (average of two different separations), analyzed by qRT–PCR. (n.s.) Not significant.
Figure 6.
Figure 6.
Model describing biosynthesis and recycling of GSH in the epidermis. (Middle) Scheme of the murine epidermis with basal, spinous, granular, and cornified layers. Arrows indicate a postulated paracrine cytoprotection of basal keratinocytes by suprabasal keratinocytes. (Left) Paracrine action of GSH and cysteine (Cys) involving suprabasal and basal layers. GSH is synthesized in a two-step reaction catalyzed by the enzymes Gcl and Gss. Extracellular cystine (Cys2), the oxidized (predominant extracellular) form of cysteine, is imported into suprabasal cells by the antiporter xc. Intracellular cystine is reduced to cysteine, which is the rate-limiting amino acid for GSH synthesis. Cysteine as well as GSH are subsequently exported by suprabasal keratinocytes. GSH export occurs via Mrp transporters. Extracellular GSH provides cysteine via a thiol exchange reaction with cystine. Extracellular cysteine can be imported directly by basal keratinocytes via the importer Asc to serve as substrate for GSH synthesis in basal keratinocytes. Genes activated by Nrf2 in keratinocytes are encircled and highlighted with blue. (Right) A suprabasal-to-basal gradient of Nrf2 and its target genes coding for ROS-detoxifying enzymes and antioxidant proteins (in red) control UVB-induced apoptosis in the murine epidermis, resulting in an antagonistic basal-to-suprabasal gradient of apoptosis (in blue).

Similar articles

Cited by

References

    1. Agar N, Young AR 2005. Melanogenesis: A photoprotective response to DNA damage? Mutat Res 571: 121–132 - PubMed
    1. Anderson RR, Parrish JA 1981. The optics of human skin. J Invest Dermatol 77: 13–19 - PubMed
    1. auf dem Keller U, Huber M, Beyer TA, Kumin A, Siemes C, Braun S, Bugnon P, Mitropoulos V, Johnson DA, Johnson JA, et al. 2006. Nrf transcription factors in keratinocytes are essential for skin tumor prevention but not for wound healing. Mol Cell Biol 26: 3773–3784 - PMC - PubMed
    1. Beyer TA, Auf dem Keller U, Braun S, Schafer M, Werner S 2007. Roles and mechanisms of action of the Nrf2 transcription factor in skin morphogenesis, wound repair and skin cancer. Cell Death Differ 14: 1250–1254 - PubMed
    1. Bickers DR, Athar M 2006. Oxidative stress in the pathogenesis of skin disease. J Invest Dermatol 126: 2565–2575 - PubMed

Publication types