

Macrophage fatty-acid synthase deficiency decreases diet-induced atherosclerosis
- PMID: 20479009
- PMCID: PMC2906331
- DOI: 10.1074/jbc.M110.100321
Macrophage fatty-acid synthase deficiency decreases diet-induced atherosclerosis
Abstract
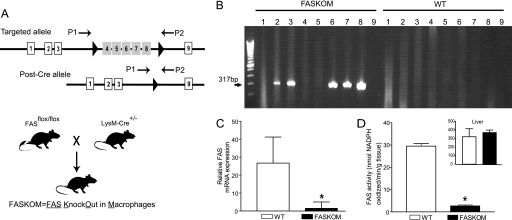
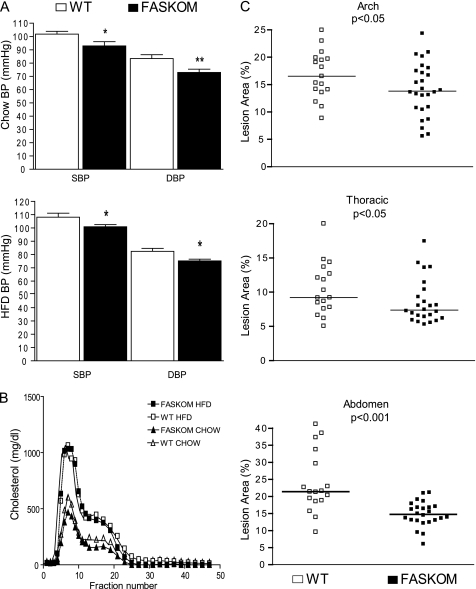
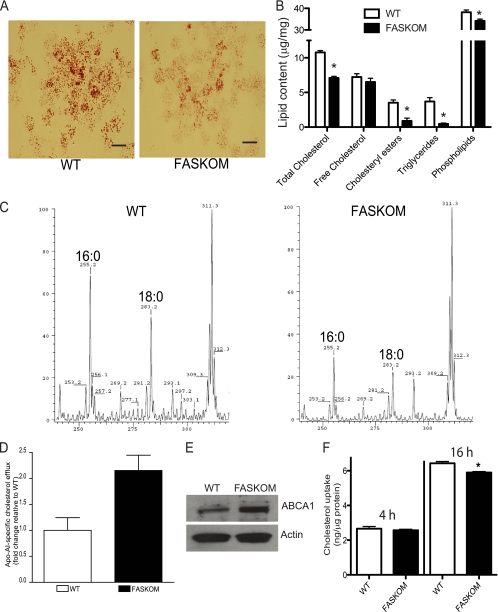
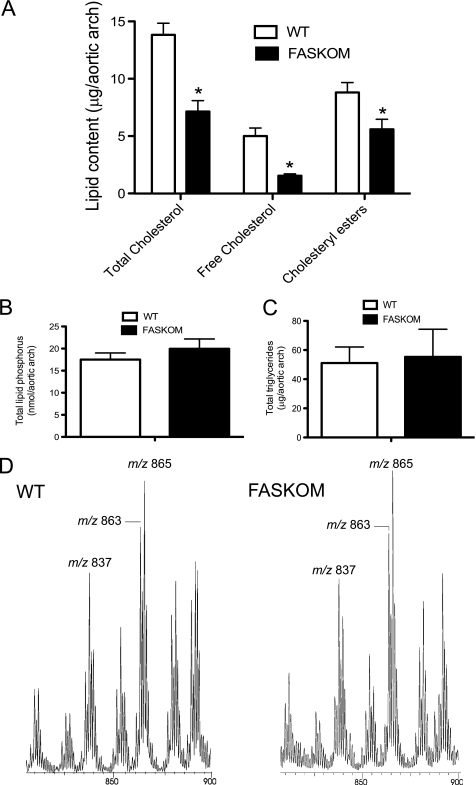
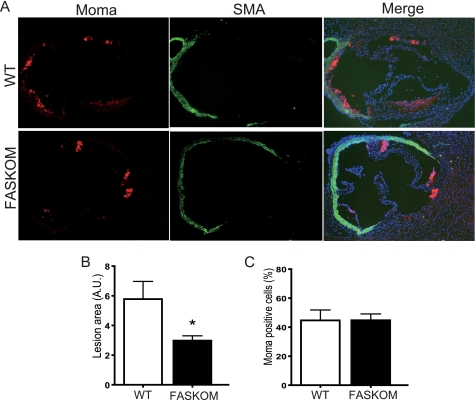
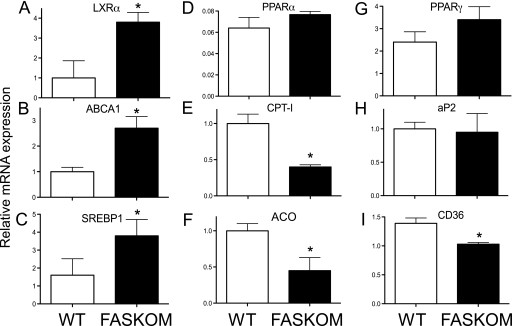
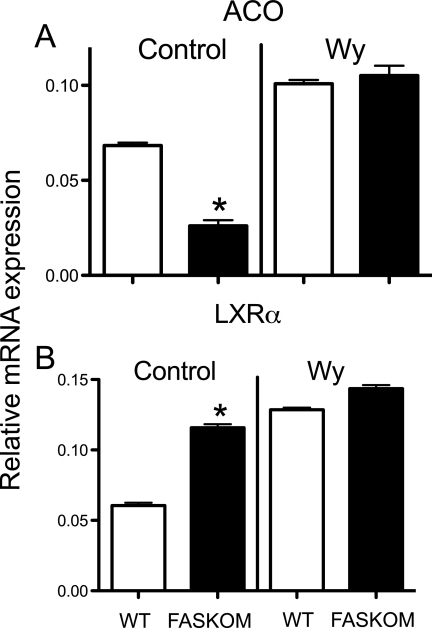
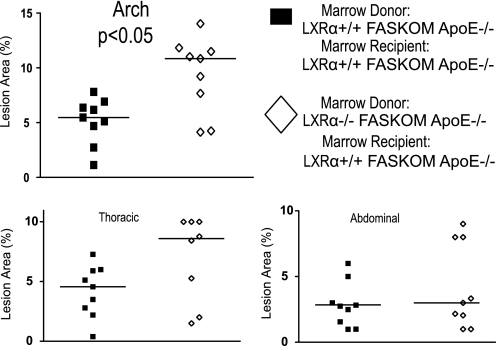
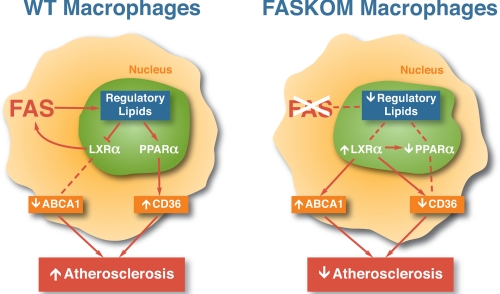
Fatty acid metabolism is perturbed in atherosclerotic lesions, but whether it affects lesion formation is unknown. To determine whether fatty acid synthesis affects atherosclerosis, we inactivated fatty-acid synthase (FAS) in macrophages of apoE-deficient mice. Serum lipids, body weight, and glucose metabolism were the same in FAS knock-out in macrophages (FASKOM) and control mice, but blood pressure was lower in FASKOM animals. Atherosclerotic extent was decreased 20-40% in different aortic regions of FASKOM as compared with control mice on Western diets. Foam cell formation was diminished in FASKOM as compared with wild type macrophages due to increased apoAI-specific cholesterol efflux and decreased uptake of oxidized low density lipoprotein. Expression of the anti-atherogenic nuclear receptor liver X receptor alpha (LXRalpha; Nr1h3) and its downstream targets, including Abca1, were increased in FASKOM macrophages, whereas expression of the potentially pro-atherogenic type B scavenger receptor CD36 was decreased. Peroxisome proliferator-activated receptor alpha (PPARalpha) target gene expression was decreased in FASKOM macrophages. PPARalpha agonist treatment of FASKOM and wild type macrophages normalized PPARalpha target gene expression as well as Nr1h3 (LXRalpha). Atherosclerotic lesions were more extensive when apoE null mice were transplanted with LXRalpha-deficient/FAS-deficient bone marrow as compared with LXRalpha-replete/FAS-deficient marrow, consistent with anti-atherogenic effects of LXRalpha in the context of FAS deficiency. These results show that macrophage FAS deficiency decreases atherosclerosis through induction of LXRalpha and suggest that FAS, which is induced by LXRalpha, may generate regulatory lipids that cause feedback inhibition of LXRalpha in macrophages.
Figures
Similar articles
-
EP 80317, a ligand of the CD36 scavenger receptor, protects apolipoprotein E-deficient mice from developing atherosclerotic lesions.FASEB J. 2005 Nov;19(13):1869-71. doi: 10.1096/fj.04-3253fje. Epub 2005 Aug 25. FASEB J. 2005. PMID: 16123174
-
Activation of soluble guanylyl cyclase prevents foam cell formation and atherosclerosis.Acta Physiol (Oxf). 2014 Apr;210(4):799-810. doi: 10.1111/apha.12210. Epub 2013 Dec 27. Acta Physiol (Oxf). 2014. PMID: 24299003
-
Functional interplay between liver X receptor and AMP-activated protein kinase α inhibits atherosclerosis in apolipoprotein E-deficient mice - a new anti-atherogenic strategy.Br J Pharmacol. 2018 May;175(9):1486-1503. doi: 10.1111/bph.14156. Epub 2018 Mar 23. Br J Pharmacol. 2018. PMID: 29394501 Free PMC article.
-
Fatty acid synthase and liver triglyceride metabolism: housekeeper or messenger?Biochim Biophys Acta. 2012 May;1821(5):747-53. doi: 10.1016/j.bbalip.2011.09.017. Epub 2011 Oct 8. Biochim Biophys Acta. 2012. PMID: 22009142 Free PMC article. Review.
-
Hypolipidemic and Anti-Atherogenic Effects of Sesamol and Possible Mechanisms of Action: A Comprehensive Review.Molecules. 2023 Apr 19;28(8):3567. doi: 10.3390/molecules28083567. Molecules. 2023. PMID: 37110801 Free PMC article. Review.
Cited by
-
Effects of soluble epoxide hydrolase inhibitor on the expression of fatty acid synthase in peripheral blood mononuclear cell in patients with acute coronary syndrome.Lipids Health Dis. 2013 Jan 10;12:3. doi: 10.1186/1476-511X-12-3. Lipids Health Dis. 2013. PMID: 23305094 Free PMC article.
-
Metabolic influence on macrophage polarization and pathogenesis.BMB Rep. 2019 Jun;52(6):360-372. doi: 10.5483/BMBRep.2019.52.6.140. BMB Rep. 2019. PMID: 31186085 Free PMC article. Review.
-
Oleic acid induces smooth muscle foam cell formation and enhances atherosclerotic lesion development via CD36.Lipids Health Dis. 2011 Apr 12;10:53. doi: 10.1186/1476-511X-10-53. Lipids Health Dis. 2011. PMID: 21486455 Free PMC article.
-
Postnatal Deletion of Fat Storage-inducing Transmembrane Protein 2 (FIT2/FITM2) Causes Lethal Enteropathy.J Biol Chem. 2015 Oct 16;290(42):25686-99. doi: 10.1074/jbc.M115.676700. Epub 2015 Aug 24. J Biol Chem. 2015. PMID: 26304121 Free PMC article.
-
Sterol carrier protein 2: A promising target in the pathogenesis of atherosclerosis.Genes Dis. 2022 Jan 10;10(2):457-467. doi: 10.1016/j.gendis.2021.12.007. eCollection 2023 Mar. Genes Dis. 2022. PMID: 37223526 Free PMC article. Review.
References
-
- Wilson P. W., D'Agostino R. B., Levy D., Belanger A. M., Silbershatz H., Kannel W. B. (1998) Circulation 97, 1837–1847 - PubMed
-
- Pekkanen J., Tervahauta M., Nissinen A., Karvonen M. J. (1993) Cardiology 82, 181–190 - PubMed
-
- Kannel W. B., Schatzkin A. (1985) J. Am. Coll. Cardiol. 5, 141B–149B - PubMed
-
- LaRosa J. C., Grundy S. M., Waters D. D., Shear C., Barter P., Fruchart J. C., Gotto A. M., Greten H., Kastelein J. J., Shepherd J., Wenger N. K. (2005) N. Engl. J. Med. 352, 1425–1435 - PubMed
Publication types
MeSH terms
Substances
Grants and funding
LinkOut - more resources
Full Text Sources
Other Literature Sources
Medical
Molecular Biology Databases
Research Materials
Miscellaneous
