. 2010 Jun 7;207(6):1247-60.
doi: 10.1084/jem.20092140. Epub 2010 May 17.

Human CD141+ (BDCA-3)+ dendritic cells (DCs) represent a unique myeloid DC subset that cross-presents necrotic cell antigens

Affiliations

Human CD141+ (BDCA-3)+ dendritic cells (DCs) represent a unique myeloid DC subset that cross-presents necrotic cell antigens

Sarah L Jongbloed et al. J Exp Med. .

Abstract

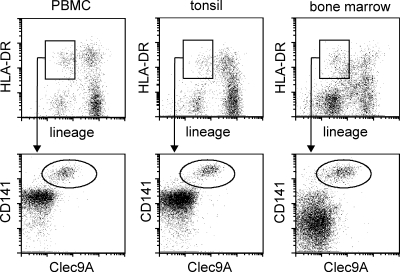
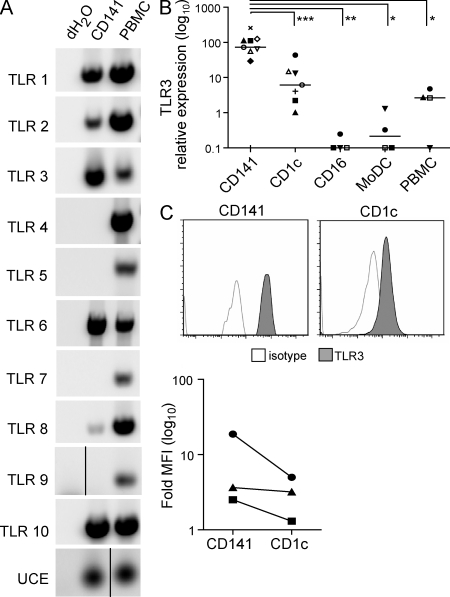
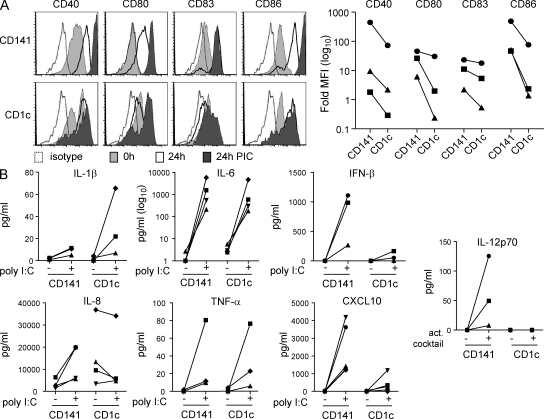
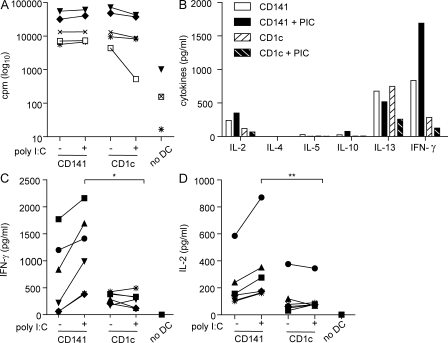
The characterization of human dendritic cell (DC) subsets is essential for the design of new vaccines. We report the first detailed functional analysis of the human CD141+ DC subset. CD141+ DCs are found in human lymph nodes, bone marrow, tonsil, and blood, and the latter proved to be the best source of highly purified cells for functional analysis. They are characterized by high expression of toll-like receptor 3, production of IL-12p70 and IFN-beta, and superior capacity to induce T helper 1 cell responses, when compared with the more commonly studied CD1c+ DC subset. Polyinosine-polycytidylic acid (poly I:C)-activated CD141+ DCs have a superior capacity to cross-present soluble protein antigen (Ag) to CD8+ cytotoxic T lymphocytes than poly I:C-activated CD1c+ DCs. Importantly, CD141+ DCs, but not CD1c+ DCs, were endowed with the capacity to cross-present viral Ag after their uptake of necrotic virus-infected cells. These findings establish the CD141+ DC subset as an important functionally distinct human DC subtype with characteristics similar to those of the mouse CD8alpha+ DC subset. The data demonstrate a role for CD141+ DCs in the induction of cytotoxic T lymphocyte responses and suggest that they may be the most relevant targets for vaccination against cancers, viruses, and other pathogens.


Figures

Figure 1.
Figure 1.
CD141+ DCs are located in human tonsil, bone marrow, and peripheral blood. DCs in human peripheral blood (PBMC), tonsil, and bone marrow were identified as lineageHLA-DR+ events (top), and CD141+CLEC9A+ cells within this population are shown (bottom). The percentage of total mononuclear cells that were CD141+CLEC9A+ for the donor illustrated was 0.05% in PBMC, 0.08% in tonsil, and 0.05% in bone marrow. Analysis of one of three donors for each tissue is shown.
Figure 2.
Figure 2.
CD141+ DCs are located in human lymph nodes. Cells expressing CLEC9A in human lymph nodes colonized the paracortex beneath the capsule and trabeculae (A–C), the more central areas of the CD3+ T cell rich paracortex (D–H), and the diffuse paracortex that protrudes between the medullary cords (I–K). Co-staining with CD209 demonstrated that neither the CD209+ antigen-presenting cells in the medullary cords nor the surrounding diffuse paracortex expressed CLEC9A (F–K). Blue represents DAPI staining of cell nuclei (A, D, E, I, J, and K). Bars: (A and F) 200 µm; (D, G, and I) 100 µm; (E) 50 µm; (B and C) 30 µm; (H, J, and K) 20 µm.
Figure 3.
Figure 3.
Isolation of CD141+ DC and CD1c+ DC from apheresis products. (A) CD141+ DCs were enriched by an initial immunomagnetic depletion of lin+ cells and sorted as CD141bright linCD1cCD15CD16. (B) CD1c+ DCs were first enriched using a BDCA-1 immunomagnetic selection kit and further purified by flow cytometry sorting to remove residual contaminating cells. Morphology of purified DC is shown at 100× magnification. Bars, 10 µm.
Figure 4.
Figure 4.
CD141+ DCs express high levels of TLR3. (A) TLR1-10 mRNA expression by purified CD141+ DC and autologous PMBC by PCR. Data are representative of three donors for TLR9 and four donors for all other TLR, with the exception that TLR7 expression was found in one of four donors. Black lines indicate that intervening lanes have been spliced out. (B) TLR3 expression on human myeloid DC subsets determined by quantitative PCR relative to ubiquitin-conjugating enzyme (UCE). *, P = 0.03; **, P = 0.02; ***, P = 0.01. Symbols represent DC isolated concurrently from the same donor. (C) TLR3 expression by fluorescent intracellular staining of CD141+ DC and autologous CD1c+ DC. Top, histograms from a representative donor. Bottom, fold increase in mean fluorescence intensity (MFI) of TLR3 over the isotype control for three donors.
Figure 5.
Figure 5.
CD141+ DCs secrete IFN-β, CXCL10, and IL-12p70. (A) Expression of costimulatory molecules CD40, CD80, CD83, and CD86 by CD141+ DC and autologous CD1c+ DC freshly isolated (0 h) or after 24-h culture in complete medium alone (24 h) or in the presence of poly I:C (24 h PIC). Left, one example of three donors is shown in histograms. Right, CD141+ DCs express higher levels of costimulatory markers after activation with poly I:C compared with autologous CD1c+ DCs. The fold increase in the MFI over the isotype control for three donors is shown. (B) Secretion of inflammatory cytokines and chemokines by CD141+ DC and autologous CD1c+ DC after stimulation with poly I:C and secretion of IL-12p70 after activation with a cocktail of poly I:C, IFN-γ, TNF, IFN-α, and IL-1β.
Figure 6.
Figure 6.
Poly I:C–activated CD141+ DCs induce superior CD4+ Th1 responses compared with CD1c+ DCs in an allogeneic MLR. (A) Allogeneic CD4+ T cell proliferation induced by unstimulated (−) or poly I:C activated (+) CD141+ DC and autologous CD1c+ DC, or in the absence of DC (no DC), measured by 3[H]-thymidine incorporation and expressed as counts per minute (cpm) after 6 d. (B) Cytokine production in the MLR cultures after 6 d. One representative donor of six is shown. (C and D) Secretion of IFN-γ (C) and IL-2 (D) in the allogeneic MLR cultures after 6 d. Each symbol represents DC isolated from the same donor in all graphs. *, P = 0.063; **, P = 0.031.
Figure 7.
Figure 7.
MHC class II processing and presentation of HCMV pp65 recombinant protein. (A) CD1c+ DCs express higher mRNA levels of MHC class II–associated molecules Ifi30, HLA-DMA, and Cathepsin H than autologous CD141+ DCs by quantitative PCR relative to ubiquitin C (UBC) in four donors. Surface expression of HLA-DR was measured by flow cytometry and expressed as the fold increase of MFI over isotype control. (B) Expression of HLA-DR on CD141+ DC and autologous CD1c+ DC freshly isolated (0 h) or after 24-h culture in complete medium alone (24 h) or in the presence of poly I:C (24 h PIC) in an example donor (histograms) and all three donors after poly I:C activation (right). (C) Lucifer yellow (LY) uptake by CD141+ DC and CD1c+ DC in the absence or presence of poly I:C (+ PIC) after 1 h of incubation at 4 or 37°C. One example donor is shown in the histograms, and LY uptake by three donors comparing the fold uptake at 37 over 4°C is shown on the right. (D) Processing and presentation of HCMV pp65 protein to CD4+ T cells by unstimulated (−) or poly I:C–activated (+) DC isolated from HCMV seropositive donors, as measured by intracellular IFN-γ production by autologous CD4+ T cells. The dotted line represents the maximum background IFN-γ production in the absence of pp65 (no Ag). One example donor is shown on the left and specific IFN-γ production (pp65-no Ag) for all three donors is shown on the right.
Figure 8.
Figure 8.
Poly I:C stimulation of CD141+ DC enhances cross-presentation of HCMV pp65 recombinant protein. (A) Expression of MHC class I on CD141+ DC and autologous CD1c+ DC freshly isolated (0 h) or after 24-h culture in complete medium alone (24 h) or in the presence of poly I:C (24 h PIC). One representative is shown in the histograms, and MFI fold increase of MHC class I expression over the isotype control for four donors after activation with poly I:C is shown on the right. (B–D) Expression of Tap1 (B), Tap2 (C), and Sec61a (D) by CD141+ DC and autologous CD1c+ DC. One example donor is shown on the left and four donors after poly I:C activation is shown on the right. (E) Presentation of the pp65495-503 peptide by CD141+ DC and CD1c+ DC from HLA-A*0201+ donors to a pp65495-503-specific CD8+ T cell line. One representative donor (left) and specific IFN-γ production (pp65495-503, no peptide) from two donors (right) is shown. (F) Cross-presentation of pp65 recombinant protein by CD141+ DC and autologous CD1c+ DC. Top, uptake of pp65 protein by DC subsets from a HLA-A*0201+ HCMV sero-negative donor and processing and presentation of the pp65495-503 epitope to pp65495-503-specific CD8+ T cells, as measured by T cell IFN-γ secretion. One example donor is shown. Cross-presentation is proteasome dependent, as it is inhibited by lactacystin (pp65 + La, one of three experiments). Bottom, specific IFN-γ production (pp65-noAg) by a pp65495-503-specific CD8+ T cell line (using DC from HLA-A*0201+ donors; black) or CD8+ T cells (using autologous DC from HLA-A*0201 HCMV sero-positive donors; white) as responders. *, P = 0.047; **, P = 0.031.
Figure 9.
Figure 9.
CD141+ DCs cross-present Ag from HCMV-infected necrotic fibroblasts. (A) Uptake of PKH-26–labeled HCMV-infected necrotic fibroblasts (nHCMV-Fb) by DC subsets after 12 h at 4 and 37°C by flow cytometry from a representative donor (left) and by three donors (right). (B) Uptake of nHCMV-Fb by confocal microscopy at 200×. Bars, 10 µm. (C) Cross-presentation of the pp6595-503 epitope after uptake of nHCMV-Fb or control uninfected Fb by CD141+ DC and CD1c+ DC subsets to a pp65-specific CD8+ T cell line, as assessed by IFN-γ secretion by the T cells. Left, one representative of four donors. Right, four donors, expressed as specific IFN-γ production (nHCMV-Fb-uninfected Fb for each cell type).

References

    1. Alexander J., McFarlane E. 2008. Can type-1 responses against intracellular pathogens be T helper 2 cytokine dependent? Microbes Infect. 10:953–959 10.1016/j.micinf.2008.07.038 - DOI - PubMed
    1. Aliberti J., Schulz O., Pennington D.J., Tsujimura H., Reis e Sousa C., Ozato K., Sher A. 2003. Essential role for ICSBP in the in vivo development of murine CD8alpha + dendritic cells. Blood. 101:305–310 10.1182/blood-2002-04-1088 - DOI - PubMed
    1. Angel C.E., Chen C.J., Horlacher O.C., Winkler S., John T., Browning J., MacGregor D., Cebon J., Dunbar P.R. 2009. Distinctive localization of antigen-presenting cells in human lymph nodes. Blood. 113:1257–1267 10.1182/blood-2008-06-165266 - DOI - PMC - PubMed
    1. Arrode G., Boccaccio C., Lulé J., Allart S., Moinard N., Abastado J.P., Alam A., Davrinche C. 2000. Incoming human cytomegalovirus pp65 (UL83) contained in apoptotic infected fibroblasts is cross-presented to CD8(+) T cells by dendritic cells. J. Virol. 74:10018–10024 10.1128/JVI.74.21.10018-10024.2000 - DOI - PMC - PubMed
    1. Bedoui S., Prato S., Mintern J., Gebhardt T., Zhan Y., Lew A.M., Heath W.R., Villadangos J.A., Segura E. 2009a. Characterization of an immediate splenic precursor of CD8+ dendritic cells capable of inducing antiviral T cell responses. J. Immunol. 182:4200–4207 10.4049/jimmunol.0802286 - DOI - PubMed

Publication types

MeSH terms