. 2010 Jun 7;207(6):1283-92.
doi: 10.1084/jem.20100223. Epub 2010 May 17.

The XC chemokine receptor 1 is a conserved selective marker of mammalian cells homologous to mouse CD8alpha+ dendritic cells

Affiliations

The XC chemokine receptor 1 is a conserved selective marker of mammalian cells homologous to mouse CD8alpha+ dendritic cells

Karine Crozat et al. J Exp Med. .

Abstract

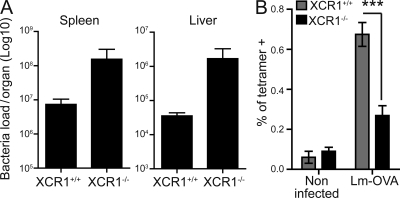
Human BDCA3+ dendritic cells (DCs) were suggested to be homologous to mouse CD8alpha+ DCs. We demonstrate that human BDCA3+ DCs are more efficient than their BDCA1+ counterparts or plasmacytoid DCs (pDCs) in cross-presenting antigen and activating CD8+ T cells, which is similar to mouse CD8alpha+ DCs as compared with CD11b+ DCs or pDCs, although with more moderate differences between human DC subsets. Yet, no specific marker was known to be shared between homologous DC subsets across species. We found that XC chemokine receptor 1 (XCR1) is specifically expressed and active in mouse CD8alpha+, human BDCA3+, and sheep CD26+ DCs and is conserved across species. The mRNA encoding the XCR1 ligand chemokine (C motif) ligand 1 (XCL1) is selectively expressed in natural killer (NK) and CD8+ T lymphocytes at steady-state and is enhanced upon activation. Moreover, the Xcl1 mRNA is selectively expressed at high levels in central memory compared with naive CD8+ T lymphocytes. Finally, XCR1-/- mice have decreased early CD8+ T cell responses to Listeria monocytogenes infection, which is associated with higher bacterial loads early in infection. Therefore, XCR1 constitutes the first conserved specific marker for cell subsets homologous to mouse CD8alpha+ DCs in higher vertebrates and promotes their ability to activate early CD8+ T cell defenses against an intracellular pathogenic bacteria.


Figures

Figure 1.
Figure 1.
Human blood BDCA3+ DCs are endowed with a higher cross-presentation ability than BDCA1+ DCs and pDCs. (A) Sorting of DC populations from PBMCs. First, CD3 and CD14-depleted PBMCs were gated based on SSC-W and SSC-A to exclude cellular doublets and on FSC-A and SSC-A. Next, CD19HLA-DR+ events and CD14CD16 events were sequentially selected. HLA-DR+CD123hi events, corresponding to pDCs, were then sorted and the remaining events falling in the HLA-DR+CD123lo/− were distinguished for BDCA1+ DC and BDCA3+ DC sorting. Sorting gates are delineated by red lines. (B) Cross-presentation assay with human DCs. Purified BDCA1+ DCs, BDCA3+ DCs, and pDCs were cultured with apoptotic cells at a 1:1 ratio for 16 h in the presence of maturation signal, 100 ng/ml LPS, 10 µg/ml poly I:C, or 10 µM R848 as indicated. After loading, DCs were extensively washed and used (5,000/well) in a 16-h IFN-γ ELISPOT assay with HIV-specific CD8+ T cells lines as effectors (15,000/well). Data are presented as the mean and range of duplicate wells for one representative experiment of at least two.
Figure 2.
Figure 2.
Xcr1 gene expression by different subsets of immune cells isolated from mice, human, and sheep. (A) Microarray analysis of the expression of the XCR1, THBD (BDCA3), CADM1, and LILRA4 (BDCA2) human genes and of the Xcr1, CD8a, Cadm1, and Siglech mouse genes in 96 different cell types or tissues, in human (top) and mouse (bottom), respectively. The human data were retrieved from the GEO database, normal tissues and cell types from the GSE7307 dataset, PBMC-derived macrophages from GSE4883, monocyte-derived DCs from GSE7509, monocyte-derived macrophages from GSM213500, and alveolar macrophages from GSE2125, and blood and tonsil DC subsets were retrieved from the E-TABM-34 dataset (Lindstedt et al., 2005) of the EBI ArrayExpress database. The data for the other leukocyte subsets directly isolated from normal human blood were described previously (Du et al., 2006; Robbins et al., 2008) and can be downloaded from http://www-microarrays.u-strasbg.fr/files/datasetsE.php. The data for the mouse were downloaded from the BioGPS public database (http://biogps.gnf.org). Green circles, pDCs (dark, blood; light, tonsil); red circles, mouse spleen CD8α+ DCs and human blood BDCA3+ DCs; orange circles, human tonsil BDCA3+ DCs; blue circles, mouse spleen CD11b+ DCs or human BDCA1+ DCs (dark, blood; light, tonsil); brown circles, mouse spleen; yellow circles, mouse lymph nodes; gray, all other cell types and tissues. Results are expressed as mean and SD for at least three independent values for most human data points. (B) Xcr1 expression determined by real-time PCR on sorted mouse spleen DC subsets and sheep leukocytes. Mouse DCs were defined as linCD11c+Bst2+ for pDCs, linCD11c+Bst2CD8α+ for CD8α+ DCs, and CD8α for CD11b+ DCs. Results are representative of at least two independent experiments. Sheep skin lymph CD1b+CD26+ and CD1b+CD26 DCs were sorted by flow cytometry to >99% purity. Sheep CD4+ T, CD8+ T, NK, and B cells were purified from afferent lymph, and CD14+ monocytes from blood, by flow cytometry sorting to >95% purity. Results are mean ± SEM of triplicate real-time RT-PCR reactions and they are representative of two different sheep for lymphocytes and of three different sheep for DCs. (C) β-galactosidase expression in splenocytes from XCR1+/+ and XCR1−/− mice. β-galactosidase expression was assessed by FDG staining. The results are shown from one mouse representative of at least eight animals studied in four independent experiments.
Figure 3.
Figure 3.
XCR1 expression and functions on mouse DC subsets from BM FLT3-L cultures. (A) DC subsets from FLT3-L BM cultures from C57BL/6Ncrl mice were sorted and examined by real-time PCR for expression of the Xcr1 gene. (B) Transwell assay on DC subsets derived from FLT3-L cultures of XCR1+/− and XCR1−/− BM cells. Results are representative of two experiments and expressed as mean ± SEM from duplicate wells for each data point. eCD8α+: FLT3-L BM-DC equivalents to spleen CD8α+ DCs and defined as SIRPαCD24+CD11c+ cells. eCD11b+: FLT3-L DC equivalents to spleen CD11b+ DCs and defined as SIRPα+CD24CD11c+ cells. pDC: FLT3-L BM-pDC defined as CD11clowSiglec-H+ cells.
Figure 4.
Figure 4.
XCR1 is functionally active on mouse CD8α+, human BDCA3+, and sheep CD26+ DCs, and Xcl1 mRNA is stored in quiescent NK cells and memory CD8+ T lymphocytes. Transwell migration assay on enriched human blood DCs or lymphocytes, sheep lymph CD26+ versus CD26 DCs, and splenic DCs from XCR1−/− and C57BL/6NCrl (XCR1+/+) mice. Results are representative of at least two independent experiments for each species and expressed as mean ± SEM from duplicate wells for each data point. (B) Expression of the XCL1 gene in human and mouse cell types and tissues, based on the same gene chips data as used in Fig. 1 A, with the following additions: black triangles, NK cells; purple triangles, resting peripheral CD8+ T cells; purple diamond, anti-CD3 activated human T cells; purple square, mouse CD8+ thymocytes; violet square, mouse CD4+ thymocytes. Results are expressed as mean and SD for at least three independent values for most human data points. (C) Expression of the XCL1 gene in sheep leukocytes as assessed by real-time PCR on the same lymph or blood cells as shown in Fig. 2. Results are mean ± SEM of triplicate real-time RT-PCR reactions, and they are representative of two different sheep for lymphocytes and of three different sheep for DCs. (D) Results of Xcl1 gene expression in mouse CD8+ T cell subsets. Xcl1 expression was measured by real-time PCR on sorted naive or TIM, or antiviral TCM CD8+ T cell subsets. Expression of Ccl5 and Ifng were also evaluated as controls, as the genes are expressed to higher levels in memory CD8+ T cells (Walzer et al., 2003). Results are represented as mean ± SD for mean values from duplicate real-time PCR reactions performed on mRNAs from naive T cells or from TIM from three individual mice each, and from TCM from four individual pools of seven mice.
Figure 5.
Figure 5.
Xcr1 evolution in vertebrates. (A). Neighbor-joining (NJ) phylogenetic analysis. Xcr1 sequences from selected vertebrate species were extracted from the Ensembl databases and aligned with relevant human CCR sequences using ClustalW. The evolutionary history was inferred using the NJ method. The bootstrap consensus tree inferred from 1,000 replicates is taken to represent the evolutionary history of the taxa analyzed. The percentages of replicate trees in which the associated taxa clustered together in the bootstrap test are shown next to the branches. The tree is drawn to scale, with branch lengths in the same units as those of the evolutionary distances used to infer the phylogenetic tree. The evolutionary distances were computed using the Poisson correction method and are in the units of the number of amino acid substitutions per site. All positions containing gaps and missing data were eliminated from the dataset (complete deletion option). There were a total of 267 positions in the final dataset. Phylogenetic analyses were conducted in MEGA4 (Tamura et al., 2007). Abbreviations for species are: HS, Homo sapiens (Ensembl ID: ENSG00000173578); BT, Bos taurus (ENSBTAG00000020019); MM, Mus musculus (ENSMUSG00000060509); FR, Fugu rubripes (ENSTRUG00000012394); GG, Gallus gallus (ENSGALG00000011735); MD, Monodelphis domestica (ENSMODG00000024025); TG, Taeniopygia guttata (ENSTGUG00000004516); DR, Danio rerio (ENSDARG00000054847, ENSDART00000077124, and ENSDART00000074943); and GA, Gasterosteus aculeatus (ENSGACG00000011742 and ENSGACG00000017177). Human CCR IDs are as follows: CX3CR1 (ENSG00000168329); CCR8 (ENSG00000179934); CCR4 (ENSG00000183813); CCR1 (ENSG00000163823); CCR3 (ENSG00000183625); CCR2 (ENSG00000121807); and CCR5 (ENSG00000160791). (B) Map of the human genes in the vicinity of the XCR1 gene. (C) Conserved syntenies retrieved in different vertebrates in the neighborhood of Xcr1. Abbreviations for species are the same as in A. The locations of the genes are given as the number of the corresponding chromosome (for mammals and birds) or linkage group (for teleost), followed by a colon and the position of the sequence in base pairs on the chromosome/group.
Figure 6.
Figure 6.
XCR1 deficiency affects Lm control and antibacterial CD8+ T cell responses early after infection. (A) Bacterial loads in the spleen and liver of XCR1−/− versus XCR1+/+ mice at day 3 after infection. Results are represented as mean ± SEM for three animals per group and from one representative experiment out of two. (B) Frequency of anti-OVA(SIINFEKL) tetramer+ cells within total spleen CD8+ T lymphocytes from Lm-OVA–infected mice at day 4 after infection. Results are represented as mean ± SEM from two independent experiments pooled for statistical analysis. ***, P < 0.005 using an unpaired Mann-Whitney non parametric test, eight mice per group.

Similar articles

Cited by

References

    1. Aoshi T., Zinselmeyer B.H., Konjufca V., Lynch J.N., Zhang X., Koide Y., Miller M.J. 2008. Bacterial entry to the splenic white pulp initiates antigen presentation to CD8+ T cells. Immunity. 29:476–486 10.1016/j.immuni.2008.06.013 - DOI - PubMed
    1. Baranek T., Zucchini N., Dalod M. 2009. Plasmacytoid dendritic cells and the control of herpesvirus infections. Viruses. 1:383–419 10.3390/v1030383 - DOI - PMC - PubMed
    1. Belz G.T., Shortman K., Bevan M.J., Heath W.R. 2005. CD8alpha+ dendritic cells selectively present MHC class I-restricted noncytolytic viral and intracellular bacterial antigens in vivo. J. Immunol. 175:196–200 - PMC - PubMed
    1. Berthon P., Hopkins J. 1996. Ruminant cluster CD14. Vet. Immunol. Immunopathol. 52:245–248 10.1016/0165-2427(96)05568-7 - DOI - PubMed
    1. Bolstad B.M., Collin F., Simpson K.M., Irizarry R.A., Speed T.P. 2004. Experimental design and low-level analysis of microarray data. Int. Rev. Neurobiol. 60:25–58 10.1016/S0074-7742(04)60002-X - DOI - PubMed

Publication types

MeSH terms