

An online calculator to compute phonotactic probability and neighborhood density on the basis of child corpora of spoken American English
- PMID: 20479181
- PMCID: PMC2946641
- DOI: 10.3758/BRM.42.2.497
An online calculator to compute phonotactic probability and neighborhood density on the basis of child corpora of spoken American English
Abstract
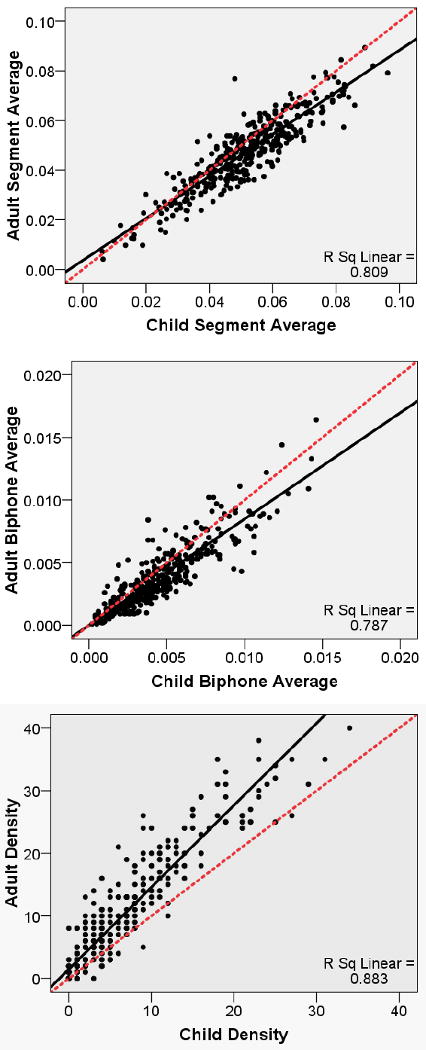
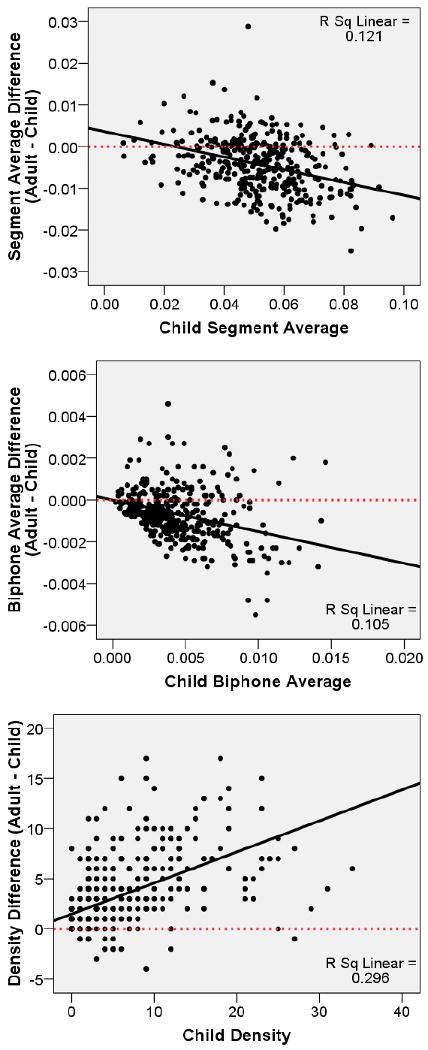
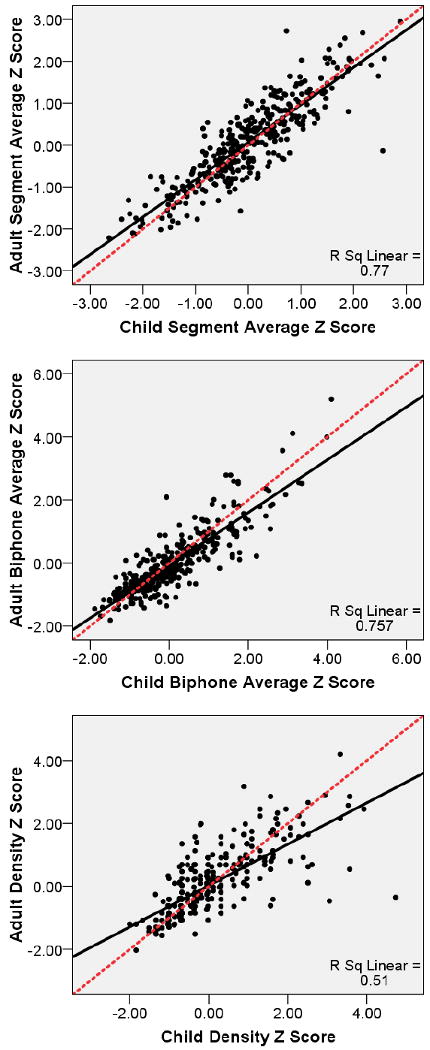
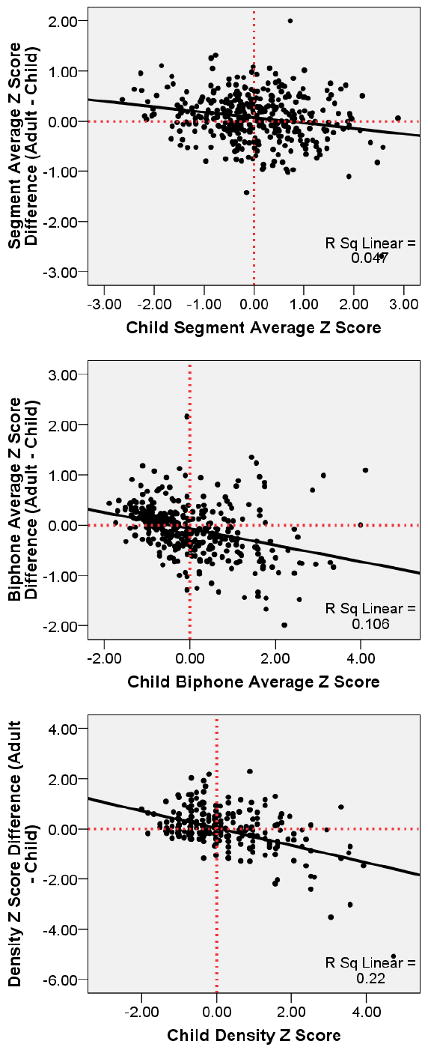
An online calculator was developed (www.bncdnet.ku.edu/cml/info_ccc.vi) to compute phonotactic probability--the likelihood of occurrence of a sound sequence--and neighborhood density--the number of phonologically similar words--on the basis of child corpora of American English (Kolson, 1960; Moe, Hopkins, & Rush, 1982) and to compare its results to those of an adult calculator. Phonotactic probability and neighborhood density were computed for a set of 380 nouns (Fenson et al., 1993) using both the child and adult corpora. The child and adult raw values were significantly correlated. However, significant differences were detected. Specifically, child phonotactic probability was higher than adult phonotactic probability, especially for high-probability words, and child neighborhood density was lower than adult neighborhood density, especially for words with high-density neighborhoods. These differences were reduced or eliminated when relative measures (i.e., z scores) were used. Suggestions are offered regarding which values to use in future research.
Figures
Similar articles
-
A web-based interface to calculate phonotactic probability for words and nonwords in English.Behav Res Methods Instrum Comput. 2004 Aug;36(3):481-7. doi: 10.3758/bf03195594. Behav Res Methods Instrum Comput. 2004. PMID: 15641436 Free PMC article.
-
Methods for minimizing the confounding effects of word length in the analysis of phonotactic probability and neighborhood density.J Speech Lang Hear Res. 2004 Dec;47(6):1454-68. doi: 10.1044/1092-4388(2004/108). J Speech Lang Hear Res. 2004. PMID: 15842022
-
A corpus of consonant-vowel-consonant real words and nonwords: comparison of phonotactic probability, neighborhood density, and consonant age of acquisition.Behav Res Methods. 2013 Dec;45(4):1159-67. doi: 10.3758/s13428-012-0309-7. Behav Res Methods. 2013. PMID: 23307574 Free PMC article.
-
Differentiating the effects of phonotactic probability and neighborhood density on vocabulary comprehension and production: a comparison of preschool children with versus without phonological delays.J Speech Lang Hear Res. 2010 Aug;53(4):933-49. doi: 10.1044/1092-4388(2009/09-0075). Epub 2010 Jun 11. J Speech Lang Hear Res. 2010. PMID: 20543024 Free PMC article.
-
Differentiating phonotactic probability and neighborhood density in adult word learning.J Speech Lang Hear Res. 2006 Dec;49(6):1175-92. doi: 10.1044/1092-4388(2006/085). J Speech Lang Hear Res. 2006. PMID: 17197489 Free PMC article.
Cited by
-
Adjective Learning in Young Typically Developing Children and Children With Developmental Language Disorder: A Retrieval-Based Approach.J Speech Lang Hear Res. 2019 Dec 5;62(12):4433-4449. doi: 10.1044/2019_JSLHR-L-19-0221. Print 2019 Dec 18. J Speech Lang Hear Res. 2019. PMID: 31805241 Free PMC article. Clinical Trial.
-
The impact of age on the treatment of late-acquired sounds in children with speech sound disorders.Clin Linguist Phon. 2023 Sep 2;37(9):783-801. doi: 10.1080/02699206.2022.2093130. Epub 2022 Jul 8. Clin Linguist Phon. 2023. PMID: 35801558 Free PMC article.
-
Maturation of Speech-in-Speech Recognition for Whispered and Voiced Speech.J Speech Lang Hear Res. 2022 Aug 17;65(8):3117-3128. doi: 10.1044/2022_JSLHR-21-00620. Epub 2022 Jul 22. J Speech Lang Hear Res. 2022. PMID: 35868232 Free PMC article.
-
A longitudinal study of the phonological organisation of novel word forms in children with developmental language disorder.Int J Speech Lang Pathol. 2022 Apr;24(2):212-223. doi: 10.1080/17549507.2021.1975816. Epub 2021 Sep 26. Int J Speech Lang Pathol. 2022. PMID: 34565237 Free PMC article.
-
Investigating a Multimodal Intervention for Children With Limited Expressive Vocabularies Associated With Autism.Am J Speech Lang Pathol. 2015 Aug;24(3):438-59. doi: 10.1044/2015_AJSLP-14-0093. Am J Speech Lang Pathol. 2015. PMID: 25910710 Free PMC article. Clinical Trial.
References
-
- Alt M, Plante E. Factors that influence lexical and semantic fast mapping of young children with specific language impairment. Journal of Speech, Language, and Hearing Research. 2006;49:941–954. - PubMed
-
- Balota DA, Yap MJ, Cortese MJ, Hutchison KA, Kessler B, Loftis B, et al. The English Lexicon Project. Behavior Research Methods. 2007;39:445–459. - PubMed
-
- Charles-Luce J, Luce PA. Similarity neighbourhoods of words in young children's lexicons. Journal of Child Language. 1990;17:205–215. - PubMed
-
- Charles-Luce J, Luce PA. An examination of similarity neighbourhoods in young children's receptive vocabularies. Journal of Child Language. 1995;22:727–735. - PubMed
Publication types
MeSH terms
Grants and funding
LinkOut - more resources
Full Text Sources
Other Literature Sources