. 2010 Jun 15;107(24):10783-90.
doi: 10.1073/pnas.0914507107. Epub 2010 May 17.

Distinct histone modifications in stem cell lines and tissue lineages from the early mouse embryo

Affiliations

Distinct histone modifications in stem cell lines and tissue lineages from the early mouse embryo

Peter J Rugg-Gunn et al. Proc Natl Acad Sci U S A. .

Abstract

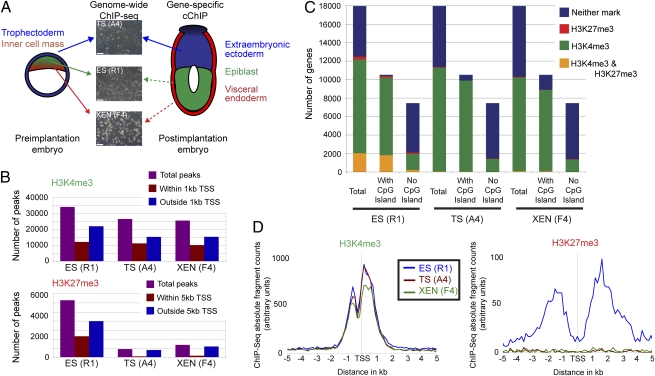
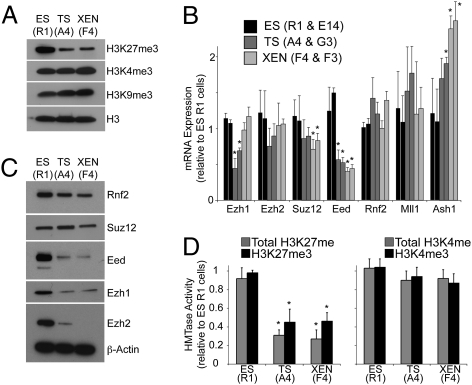
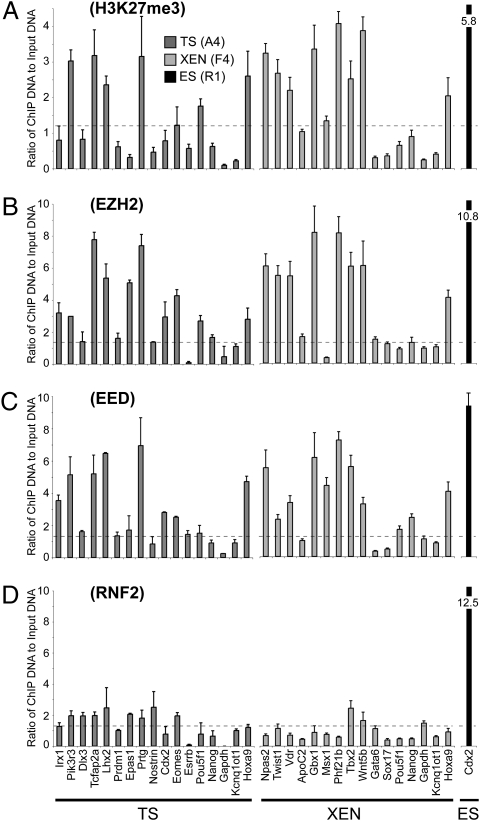
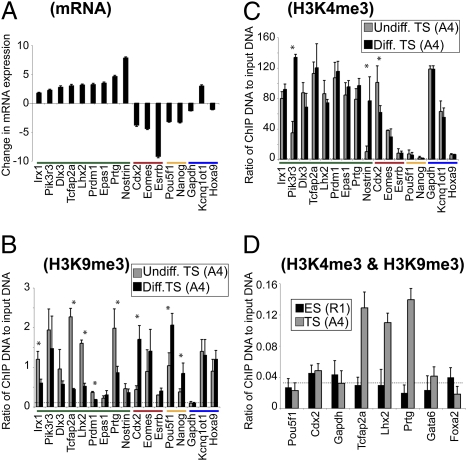
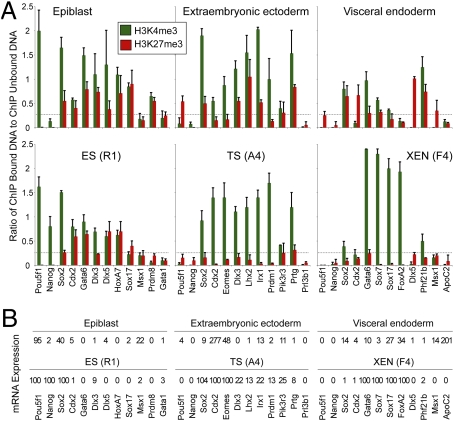
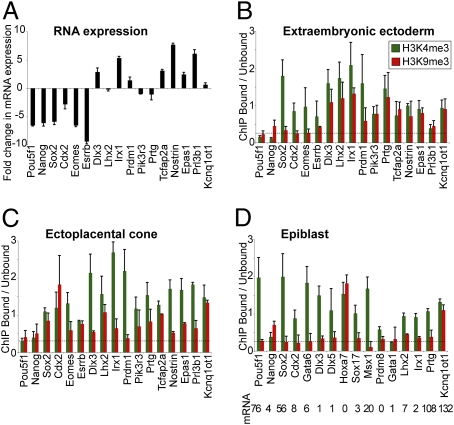
A unique property of the mammalian embryo is that stem cells can be derived from its early tissue lineages. These lineages will give rise to the fetus as well as essential extraembryonic tissues. Understanding how chromatin regulation participates in establishment of these lineages in the embryo and their derived stem cells provides insight that will critically inform our understanding of embryogenesis and stem cell biology. Here, we compare the genomewide location of active and repressive histone modifications in embryonic stem cells, trophoblast stem cells, and extraembryonic endoderm stem cells from the mouse. Our results show that the active modification H3K4me3 has a similar role in the three stem cell types, but the repressive modification H3K27me3 varies in abundance and genomewide distribution. Thus, alternative mechanisms mediate transcriptional repression in stem cells from the embryo. In addition, using carrier chromatin immunoprecipitation we show that bivalent histone domains seen in embryonic stem cells exist in pluripotent cells of the early embryo. However, the epigenetic status of extraembryonic progenitor cells in the embryo did not entirely reflect the extraembryonic stem cell lines. These studies indicate that histone modification mechanisms may differ between early embryo lineages and emphasize the importance of examining in vivo and in vitro progenitor cells.


Conflict of interest statement

The authors declare no conflict of interest.

Figures

Fig. 1.
Fig. 1.
Analysis of genomewide histone states reveal differences in H3K27me3 between ES (R1), TS (A4), and XEN (F4) cells. (A) Overview of the experimental approach used to examine histone modifications of lineage progenitors from early mouse embryos. Arrows indicate source of tissue used for ES, TS, and XEN cell derivation, with dashed arrows indicating cells of the same developmental lineage. (Bar, 100 μM.) (B) Analysis of chromosome 19 reveals that a similar number of regions within 1 kb from TSS contain H3K4me3 peaks in ES, TS, and XEN cells. In contrast, the number of H3K27me3 peaks is lower in TS and XEN cells, and a smaller proportion of these peaks are located within 5 kb from TSS compared with ES cells. (C) The number of gene promoters in the genome that are modified with H3K4me3, H3K27me3, H3K4me3 and H3K27me3 or neither. Fewer promoters are marked by H3K27me3 in TS and XEN, compared to ES cells. Genes are further subdivided into those with or without a CpG island. Although the number of H3K4me3/H3K27me3 marked genes is low in TS and XEN cells, gene ontology analysis revealed that genes within this category were involved in organ development, chromatin assembly, metabolic processes, and cell cycle (Fig. S7). (D) Distribution of H3K4me3 relative to the nearest TSS reveals a highly similar profile between ES, TS, and XEN cells (ES, n = 13,131 genes; TS, n = 11,637; XEN, n = 10,660). Distribution of H3K27me3 relative to the nearest TSS shows that H3K27me3 is localized to promoter regions in ES cells only (ES, n = 2,320 genes; TS, n = 104; XEN, n = 171).
Fig. 2.
Fig. 2.
PRC2 expression and activity are low in extraembryonic stem cells. (A) Western blot analysis shows that global levels of H3K27me3 are lower in TS (A4) and XEN (F4) cells, compared to ES (R1) cells. H3K4me3 and H3K9me3 are detected at similar levels in the three stem cell types. Unmodified histone H3 was used as a loading control. (B) qRT-PCR analysis of levels of PRC2 components Ezh1, Ezh2, Suz12, and Eed; PRC1 component, Rnf2, and two H3K4 methyltransferases, Mll1 and Ash1. Data represent mean plus SD from three biological replicates. For each stem cell type, two independent lines were analyzed. Asterisks indicate statistically significant difference as compared to ES cells, P < 0.05 (Student's t test). (C) Western blot analysis shows that expression of PRC2 components Eed, Ezh1, and Ezh2 is lower in TS (A4) and XEN (F4) cells, compared to ES (R1) cells. Suz12 and Rnf2 are expressed at similar levels. β-Actin was used as a loading control. (D) Total H3K27 and H3K27me3-specific histone methyltransferase activity is significantly lower in TS (A4) and XEN (F4) cells, compared to ES (R1) cells. No significant differences in total H3K4 or H3K4me3-specific histone methyltransferase activity were detected. Data represent mean plus SD from three biological replicates. For each stem cell type, two independent cell lines were analyzed and data combined. Asterisks indicate statistically significant difference as compared to ES cells, P < 0.05 (Student's t test).
Fig. 3.
Fig. 3.
Differences in PRC1 binding between TS/XEN cells and ES cells. (AD) The ability of H3K27me3 to recruit downstream mediators in TS and XEN cells was investigated using ChIP-qPCR on a panel of candidate gene promoters. We included H3K27me3-modified and unmodified promoters that were identified by our genomewide analysis. The panel also contains bivalent promoters classified in ES cells as PRC1-positive (Irx1, Dlx3, Tcfap2a, Lhx2, Npas2, Gbx1, Msx1, Tbx2, Gata6, and Sox17) and PRC1-negative (Pik3r3, Prtg, and Nostrin) (34). Positive (Hoxa9 and Pou5f1) and negative (Gapdh and Kcnq1ot1) control promoters for H3K27me3 were included (61). Ezh2 and Eed binding was detected above background levels at H3K27me3-modified promoters in TS (A4) and XEN (F4) cells. However, binding of the downstream mediator Rnf2 was detected only at low or negligible levels, irrespective of H3K27me3, Ezh2, or Eed status. As we could not identify a promoter that was bound by Rnf2 in TS and XEN cells, we used the Cdx2 promoter in ES (R1) cells as a positive control (indicated by the black bar) (34). Data represent mean plus SD from three biological replicates. Dashed lines indicate 2-fold of mean background levels, as determined using a nonspecific control antibody (background data shown in Fig. S8A).
Fig. 4.
Fig. 4.
H3K9me3 correlates inversely with gene transcription during TS cell differentiation. (A) qRT-PCR analysis reveals fold change in expression of mature mRNA transcripts in differentiated TS cells, as compared to undifferentiated TS cells (log 2 scale; TS cell line A4). For reference, genes are grouped according to their change in expression status upon TS cell differentiation: induced (green), extraembryonic factors that are repressed (red), and embryonic factors that are repressed (yellow). Gapdh, Kcnq1ot1, and Hoxa9 (blue) promoters provide control regions (46, 61). Data represent mean plus SD of three biological replicates. ChIP experiments demonstrate changes in (B) H3K9me3 and (C) H3K4me3 that accompany gene transcription during TS (A4) cell differentiation. Dashed lines indicate 2-fold of mean background levels, as determined using a nonspecific control antibody (Fig. S8B). Asterisks indicate a statistically significant difference between undifferentiated and differentiated TS cells, P < 0.05 (Student's t test). Data represent mean plus SD of three biological replicates. The same experiments were performed using an additional TS cell line (G3) and gave highly similar results (Fig. S4). (D) Sequential ChIP experiments confirm the coexistence of H3K4me3 and H3K9me3 in undifferentiated TS (A4) cells. Cdx2 and Gapdh in TS cells and Pou5f1 and Gapdh in ES cells are known to be modified by H3K4me3 only and served as controls for the specificity of the H3K9me3 immunoprecipitation. Dashed lines indicate 2-fold of mean background levels, as determined using anti-H3K4me3 in the first immunoprecipitation and a nonspecific control antibody in the second immunoprecipitation (Fig. S8C). Data represent mean plus SD of three biological replicates.
Fig. 5.
Fig. 5.
Analysis of histone modifications in lineage progenitor cells of early mouse embryos. (A) cChIP experiments examine EPI and ES (R1) cells (Left); ExE and TS (A4) cells (Middle); VE and XEN (F4) cells (Right). Gene names are shown at the base of each column and include known lineage-specific transcription factors (Pou5f1, Nanog, Cdx2, Eomes, Gata6, and Sox7), genes known to be bivalent in ES cells (Cdx2, Gata6, Hoxa7, and Sox17), and genes that are characteristic of fully differentiated cell types (Gata1, Prl3b1, and ApoC2). Antibodies used were against H3K4me3 (green) and H3K27me3 (red). Dashed lines indicate 2-fold of mean background levels, as determined using a nonspecific control antibody (Fig. S8D). Mean plus SD are shown from two biological replicates. cChIP analyses of alternative ES, TS, and XEN cell lines show similar results (Fig. S5C). (B) Corresponding mRNA expression levels for each cell type. Values represent percentages relative to reference tissues (specified in SI Methods). Each value represents the mean from two biological replicates.
Fig. 6.
Fig. 6.
Analysis of H3K9me3 during trophoblast differentiation in early mouse embryos. (A) qRT-PCR analysis reveals fold change in expression of mature mRNA transcripts in EPC (differentiated trophoblast), as compared to ExE (undifferentiated trophoblast) (log 2 scale). (B and C) cChIP experiments reveal the gene-specific differences in H3K9me3 and H3K4me3 between (B) ExE and (C) EPC. In general, promoters that are induced upon trophoblast differentiation (Dlx3, Irx1, Tcfap2a, Nostrin, and Epas1) show an increase in H3K4me3 and a decrease in H3K9me3 when comparing EPC with ExE. Kcnq1ot1 is used as a positive control (46). Mean and SD are from two biological replicates. (D) cChIP experiments show that genes known to be bivalent in ES cells (Cdx2, Gata6, and Sox17) or marked by H3K4me3/H3K9me3 in TS cells (Dlx3, Lhx2, Irx1, and Prtg) are not modified by H3K9me3 in EPI above background levels (indicated by the dashed line). The imprinted gene Kcnq1ot1 is used as a positive control (22, 23). Mean and SD are from two biological replicates. Shown underneath are the corresponding mRNA expression levels, relative to the same reference tissues used in Fig. 5B.

Similar articles

Cited by

References

    1. Rossant J, Chazaud C, Yamanaka Y. Lineage allocation and asymmetries in the early mouse embryo. Philos Trans R Soc Lond B Biol Sci. 2003;358:1341–1348. discussion 1349. - PMC - PubMed
    1. Hemberger M, Dean W, Reik W. Epigenetic dynamics of stem cells and cell lineage commitment: Digging Waddington's canal. Nat Rev Mol Cell Biol. 2009;10:526–537. - PubMed
    1. Ng RK, et al. Epigenetic restriction of embryonic cell lineage fate by methylation of Elf5. Nat Cell Biol. 2008;10:1280–1290. - PMC - PubMed
    1. Surani MA, Hayashi K, Hajkova P. Genetic and epigenetic regulators of pluripotency. Cell. 2007;128:747–762. - PubMed
    1. Yuan P, et al. Eset partners with Oct4 to restrict extraembryonic trophoblast lineage potential in embryonic stem cells. Genes Dev. 2009;23:2507–2520. - PMC - PubMed

Publication types

MeSH terms

Associated data