. 2010 May 17;189(4):713-23.
doi: 10.1083/jcb.200910142.

Cooperation of the Dam1 and Ndc80 kinetochore complexes enhances microtubule coupling and is regulated by aurora B

Affiliations

Cooperation of the Dam1 and Ndc80 kinetochore complexes enhances microtubule coupling and is regulated by aurora B

Jerry F Tien et al. J Cell Biol. .

Abstract

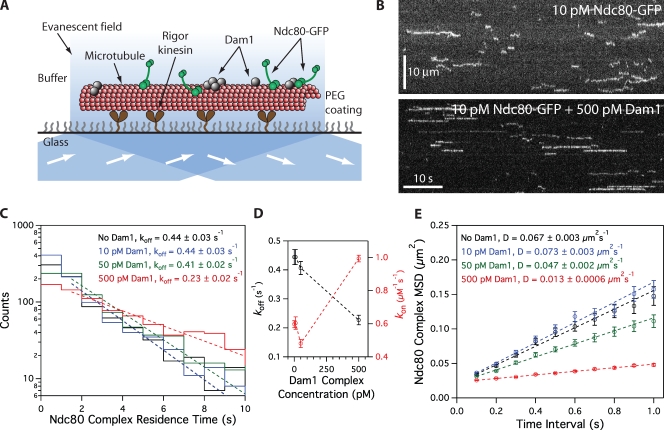
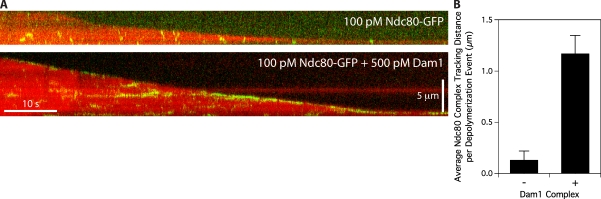
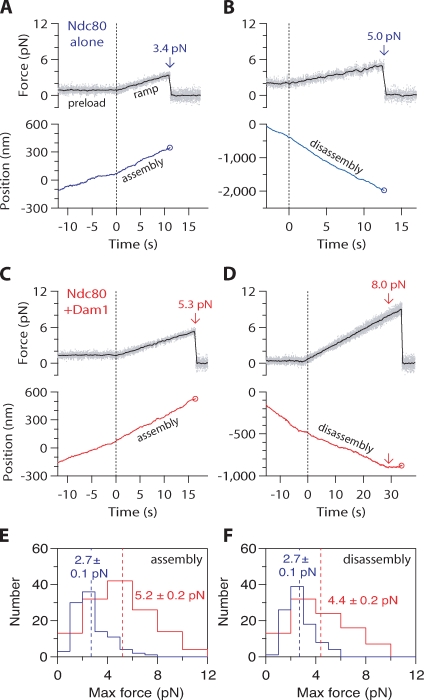
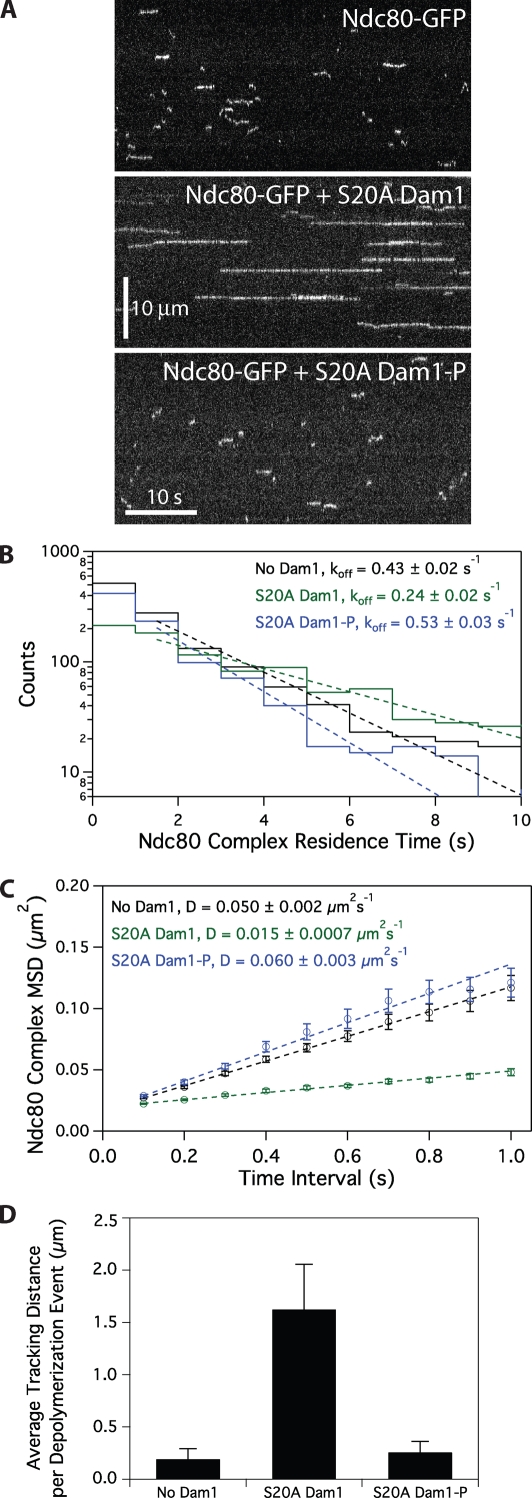
The coupling of kinetochores to dynamic spindle microtubules is crucial for chromosome positioning and segregation, error correction, and cell cycle progression. How these fundamental attachments are made and persist under tensile forces from the spindle remain important questions. As microtubule-binding elements, the budding yeast Ndc80 and Dam1 kinetochore complexes are essential and not redundant, but their distinct contributions are unknown. In this study, we show that the Dam1 complex is a processivity factor for the Ndc80 complex, enhancing the ability of the Ndc80 complex to form load-bearing attachments to and track with dynamic microtubule tips in vitro. Moreover, the interaction between the Ndc80 and Dam1 complexes is abolished when the Dam1 complex is phosphorylated by the yeast aurora B kinase Ipl1. This provides evidence for a mechanism by which aurora B resets aberrant kinetochore-microtubule attachments. We propose that the action of the Dam1 complex as a processivity factor in kinetochore-microtubule attachment is regulated by conserved signals for error correction.


Figures

Figure 1.
Figure 1.
Dam1 complex enhances binding of individual Ndc80 complexes to microtubules. (A) Schematic of the TIRF assay developed to visualize the behavior of GFP-tagged Ndc80 complexes (green rods) in the presence of untagged Dam1 complexes (gray spheres) on microtubules. (B) Representative kymographs showing the binding and one-dimensional diffusion of 10 pM Ndc80 complexes on taxol-stabilized microtubules in the absence or presence of 500 pM Dam1 complex. Positions along the microtubule are shown on the vertical axis, whereas the passage of time is depicted along the horizontal axis. Concentrations are of free complexes in solution. (C) Residence time distributions of 10 pM Ndc80 complex on microtubules without Dam1 complex (black histogram; n = 883 events), with 10 pM Dam1 complex (blue histogram; n = 966), 50 pM Dam1 complex (green histogram; n = 928), and 500 pM Dam1 complex (red histogram; n = 1,003). Dotted lines show the weighted exponential fits used to determine dissociation rate constants, koff. (D) Dissociation rate constants (koff; left axis, black markers) for the Ndc80 complex, calculated from the data in C, are plotted against the concentration of Dam1 complex. Association rate constants (kon; right axis, red markers) of the Ndc80 complex are also plotted (without Dam1 complex, n = 1,103; with 10 pM Dam1 complex, n = 1,426; with 50 pM Dam1 complex, n = 1,179; with 500 pM Dam1 complex, n = 1,412). (E) Mean-squared displacement (MSD) is plotted against time for 10 pM Ndc80 complex on microtubules without Dam1 complex (black markers; n = 803 events), with 10 pM Dam1 complex (blue markers; n = 859), 50 pM Dam1 complex (green markers; n = 883), and 500 pM Dam1 complex (red markers; n = 968). Dotted lines show the weighted linear fits used to determine diffusion constants, D. Markers indicate SEM.
Figure 2.
Figure 2.
Dam1 complex does not affect the oligomerization state of the Ndc80 complex on microtubules. Mean initial brightness distributions of 10 pM GFP-tagged Ndc80 complex–binding events on microtubules without Dam1 complex (black histogram; n = 883 events), with 10 pM Dam1 complex (blue histogram; n = 966), 50 pM Dam1 complex (green histogram; n = 928), and 500 pM Dam1 complex (red histogram; n = 1,003). Dotted lines show Gaussian fits used to determine mean values ± SD. These values are similar to the mean brightness from rare single-bleach steps of GFP-tagged Ndc80 complex (9,300 ± 3,200 au; n = 11). For clarity, green, blue, and black histograms are offset vertically by 120, 240, and 360 counts, respectively.
Figure 3.
Figure 3.
Assembly of oligomeric rings of the Dam1 complex around microtubules. (A) Negative-stain electron micrographs of oligomeric rings formed by the Dam1 complex around taxol-stabilized microtubules. (B) The number of rings observed per unit length (micrometers) of microtubule was quantified (statistics shown in Table I) and plotted against the total concentration of Dam1 complex. Error bars represent counting uncertainties.
Figure 4.
Figure 4.
Ndc80 complex tracks with disassembling tips in the presence of Dam1 complex. (A) Representative two-color kymographs showing the tip tracking ability of 100 pM Ndc80 complex in the presence or absence of 500 pM Dam1 complex. Movement of GFP-tagged Ndc80 complex (green) is shown on disassembling microtubules (red). Concentrations are of free complexes in solution. (B) Mean tracking distance of Ndc80 complex per depolymerization event in the absence of Dam1 complex (n = 19) or in the presence of 500 pM Dam1 complex (n = 62). Error bars indicate SEM.
Figure 5.
Figure 5.
Dam1 complex enhances the coupling of bead-bound Ndc80 complex to assembling microtubule tips under fixed load. (A) Representative records of bead position versus time for microtubule tip attachments by bead-bound Ndc80 complex in the absence (blue traces) or presence (red traces) of free Dam1 complex during continuous application of tensile load. Increasing position represents assembly-coupled movement in the direction of applied force. Arrows mark transitions from assembly to disassembly. Decreasing position represents disassembly-driven movement against the applied force. Circles indicate detachment. For clarity, each record is offset vertically by an arbitrary amount. (B) Rates of bead detachment from assembling microtubule tips are estimated by counting the number of detachment events and dividing by total observation time. Error bars represent uncertainty based on Poisson statistics. (C) Survival probability versus distance for attachments composed of bead-bound Ndc80 complex in the absence (blue) or presence (red) of free Dam1 complex. The survival probability is the number of events that persisted beyond a given distance divided by the total number of events.
Figure 6.
Figure 6.
Dam1 complex enhances the coupling of bead-bound Ndc80 complex to assembling and disassembling microtubule tips across a range of loads. (A–D) Representative records showing tensile force (top) and bead position (bottom) versus time for bead-bound Ndc80 complexes attached to assembling and disassembling microtubule tips in the absence (A and B) or presence (C and D) of free Dam1 complex. The instrument was programmed to automatically increase the force at a constant rate (0.25 pN × s−1) after ∼500 nm of movement occurred. Arrows mark maximum forces, recorded either at rupture or when the microtubule switched from disassembly to assembly. Circles mark ruptures. (E) Distributions of maximum force for bead-bound Ndc80 complexes attached to assembling tips in the absence (blue histogram; n = 101) or presence (red histogram; n = 131) of free Dam1 complex. (F) Distributions of maximum force for bead-bound Ndc80 complexes attached to disassembling tips in the absence (blue histogram; n = 96), or presence (red histogram; n = 92) of free Dam1 complex. Dotted vertical lines indicate the mean for each distribution. Uncertainties represent standard errors.
Figure 7.
Figure 7.
Ipl1 phosphorylation of the Dam1 complex regulates its interaction with the Ndc80 complex. (A) Representative kymographs showing changes in behavior of 10 pM Ndc80 complex with the addition of 500 pM S20A Dam1 complex with or without Ipl1 phosphorylation. Concentrations are of free complexes in solution. (B) Residence time distributions of 10 pM Ndc80 complex on microtubules without Dam1 complex (black histogram, n = 1,266 events), with 500 pM S20A Dam1 complex (green histogram, n = 1,081), and 500 pM Ipl1-phosphorylated S20A Dam1 complex (blue histogram, n = 974). Dotted lines show the weighted exponential fits used to determine dissociation rate constants, koff. (C) Mean-squared displacement (MSD) is plotted against time for 10 pM Ndc80 complex on microtubules without Dam1 complex (black markers, n = 1,102), with 500 pM S20A Dam1 complex (green markers, n = 1,030), and with 500 pM Ipl1-phosphorylated S20A Dam1 complex (blue markers, n = 860). Dotted lines show the weighted linear fits used to determine diffusion constants, D. (D) Mean tracking distance of 100 pM Ndc80 complex per depolymerization event in the absence of Dam1 complex (n = 19), in the presence of 500 pM S20A Dam1 complex (n = 28), or in the presence of 500 pM Ipl1-phosphorylated S20A Dam1 complex (n = 39). Error bars indicate SEM.

References

    1. Akiyoshi B., Nelson C.R., Ranish J.A., Biggins S. 2009. Analysis of Ipl1-mediated phosphorylation of the Ndc80 kinetochore protein in Saccharomyces cerevisiae. Genetics. 183:1591–1595 10.1534/genetics.109.109041 - DOI - PMC - PubMed
    1. Asbury C.L., Gestaut D.R., Powers A.F., Franck A.D., Davis T.N. 2006. The Dam1 kinetochore complex harnesses microtubule dynamics to produce force and movement. Proc. Natl. Acad. Sci. USA. 103:9873–9878 10.1073/pnas.0602249103 - DOI - PMC - PubMed
    1. Biggins S., Severin F.F., Bhalla N., Sassoon I., Hyman A.A., Murray A.W. 1999. The conserved protein kinase Ipl1 regulates microtubule binding to kinetochores in budding yeast. Genes Dev. 13:532–544 10.1101/gad.13.5.532 - DOI - PMC - PubMed
    1. Cheeseman I.M., Anderson S., Jwa M., Green E.M., Kang J., Yates J.R., III, Chan C.S., Drubin D.G., Barnes G. 2002. Phospho-regulation of kinetochore-microtubule attachments by the Aurora kinase Ipl1p. Cell. 111:163–172 10.1016/S0092-8674(02)00973-X - DOI - PubMed
    1. Cheeseman I.M., Chappie J.S., Wilson-Kubalek E.M., Desai A. 2006. The conserved KMN network constitutes the core microtubule-binding site of the kinetochore. Cell. 127:983–997 10.1016/j.cell.2006.09.039 - DOI - PubMed

Publication types

MeSH terms