. 2010 May 7;5(5):e10531.
doi: 10.1371/journal.pone.0010531.

Global chromatin architecture reflects pluripotency and lineage commitment in the early mouse embryo

Affiliations

Global chromatin architecture reflects pluripotency and lineage commitment in the early mouse embryo

Kashif Ahmed et al. PLoS One. .

Abstract

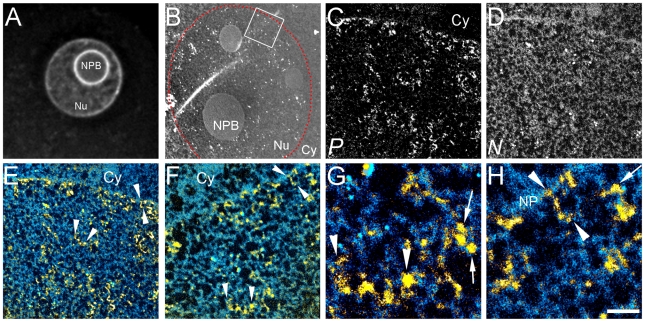
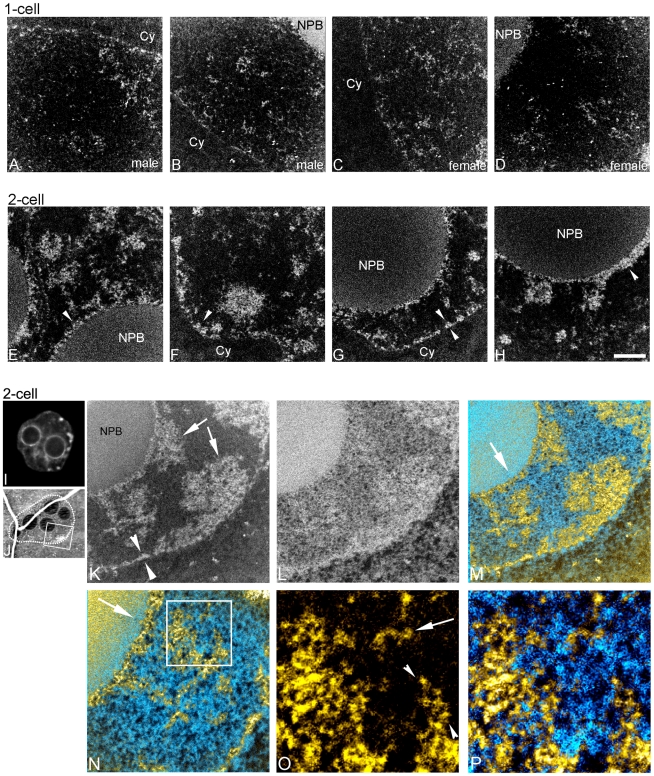
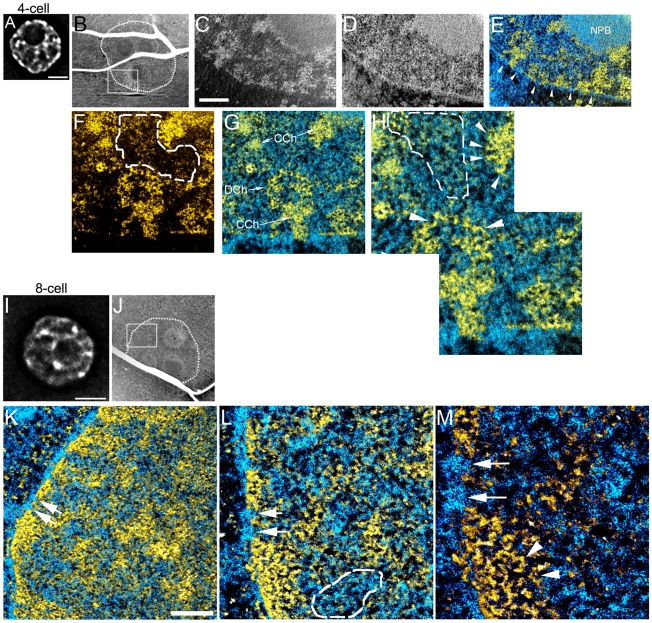
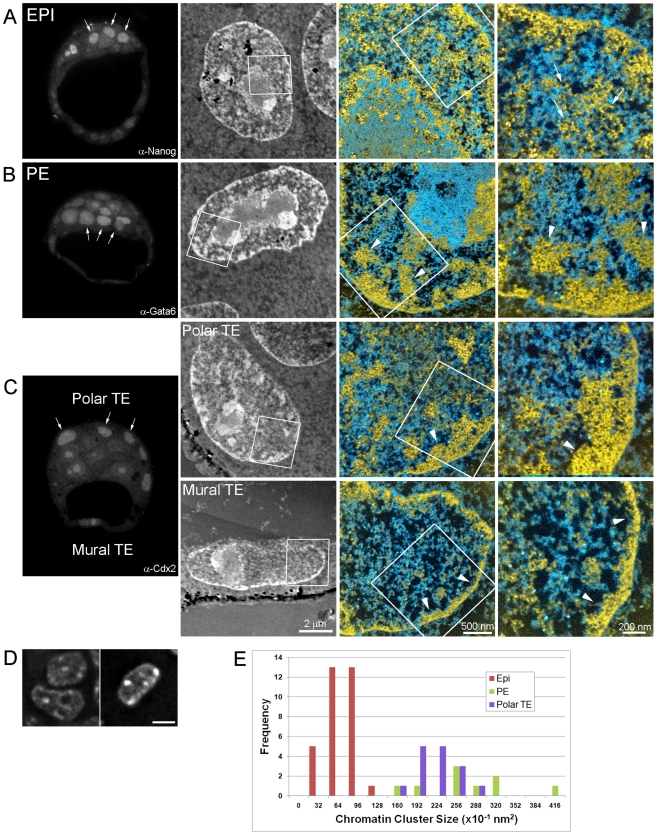
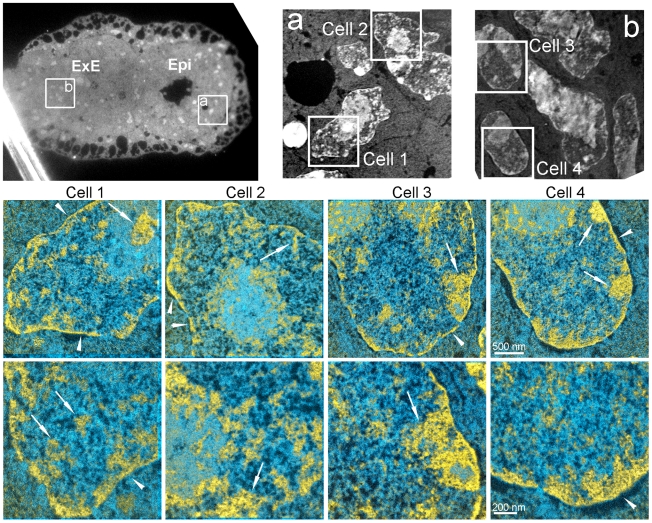
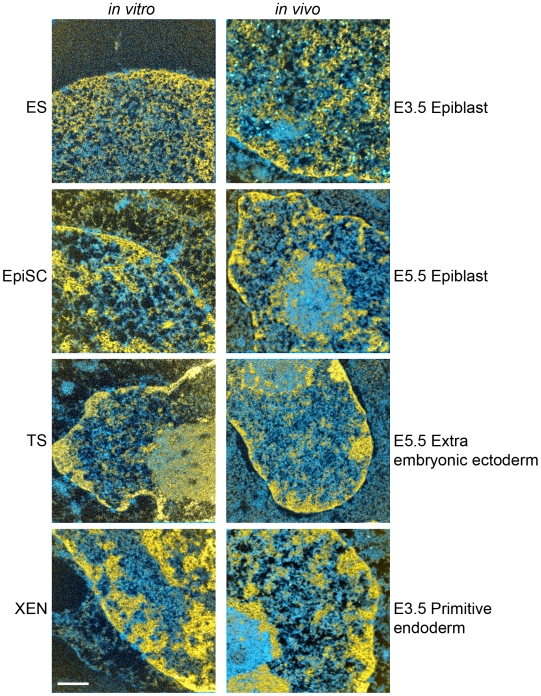
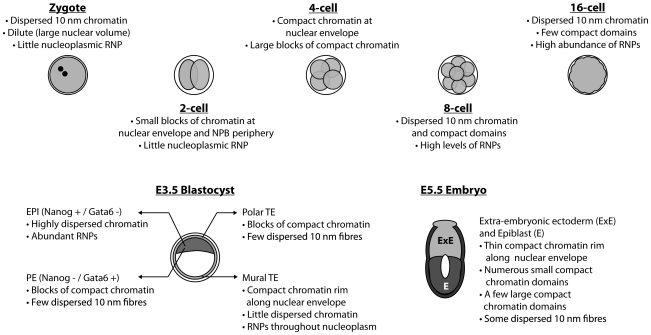
An open chromatin architecture devoid of compact chromatin is thought to be associated with pluripotency in embryonic stem cells. Establishing this distinct epigenetic state may also be required for somatic cell reprogramming. However, there has been little direct examination of global structural domains of chromatin during the founding and loss of pluripotency that occurs in preimplantation mouse development. Here, we used electron spectroscopic imaging to examine large-scale chromatin structural changes during the transition from one-cell to early postimplantation stage embryos. In one-cell embryos chromatin was extensively dispersed with no noticeable accumulation at the nuclear envelope. Major changes were observed from one-cell to two-cell stage embryos, where chromatin became confined to discrete blocks of compaction and with an increased concentration at the nuclear envelope. In eight-cell embryos and pluripotent epiblast cells, chromatin was primarily distributed as an extended meshwork of uncompacted fibres and was indistinguishable from chromatin organization in embryonic stem cells. In contrast, lineage-committed trophectoderm and primitive endoderm cells, and the stem cell lines derived from these tissues, displayed higher levels of chromatin compaction, suggesting an association between developmental potential and chromatin organisation. We examined this association in vivo and found that deletion of Oct4, a factor required for pluripotency, caused the formation of large blocks of compact chromatin in putative epiblast cells. Together, these studies show that an open chromatin architecture is established in the embryonic lineages during development and is sufficient to distinguish pluripotent cells from tissue-restricted progenitor cells.


Conflict of interest statement

Competing Interests: The authors have declared that no competing interests exist.

Figures

Figure 1
Figure 1. Highly dispersed 10 nm chromatin fibres in pronuclei of one-cell embryo.
(A) Fluorescence image of a DAPI stained male pronucleus. (B) Low magnification mass image of a male pronucleus (nuclear periphery highlighted with dotted line; Nu, nucleus; Cy, cytoplasm; NPB, nucleolar precursor body; NP, nuclear pore). Phosphorus (P) and nitrogen (N) maps of the indicated field are shown in C and D respectively. Relationships of nucleic acid- (yellow) and protein-based (blue) structures of the field in C, D is shown at two magnifications in E and F. Phosphorus signal (yellow) is merged with the nitrogen minus the phosphorus map (see Materials and Methods). Chromatin fibres indicated (E,F) (arrowheads) are shown at higher magnification (G,H, respectively). Nucleosomes, identified on the basis of dimensions and phosphorus and nitrogen content are indicated (arrows, G,H). Scale bar in H represents 7 µm (A), 3 µm (B), 500 nm (C–E), 250 nm (F), and 60 nm (G,H).
Figure 2
Figure 2. Chromatin becomes more compact and concentrated at nuclear envelope and periphery of nucleolar precursor bodies between one-and two-cell stage embryos.
Phosphorus maps (white on black background) of male (A,B) and female (C,D) pronuclei in one-cell embryo. Phosphorus maps of nuclei of two-cell embryos (E–H) (NPB, nucleolar precursor body; Cy, cytoplasm). Fluorescence image of a DAPI stained nucleus of a two-cell embryo (I). Low magnification mass image (J) of two-cell embryo showing the nucleus imaged in K–P. Phosphorus (K) and nitrogen (L) maps of a field of the two-cell embryo. Arrowheads (K) indicate chromatin organization along nuclear envelope, and arrows (K) indicate blocks of compact chromatin. Merge of phosphorus and nitrogen maps (M). N, higher magnification of field from M. Arrow shows relative orientation of the lower (M) and higher magnification view (N), and indicates chromatin accumulation on the periphery of a NPB. Phosphorus map (O) and merged phosphorus and nitrogen maps (P) of boxed region (N) are shown at higher magnification. Loop(s) of 10 nm chromatin fibre on the edge of a block of compact chromatin is indicated with arrowheads, and a chromatin fibre is indicated with arrow (O). Scale bar in H represents 500 nm (A–H), 7.5 µm (I), 400 nm (K–M), 250 nm (N) and 80 nm (O,P).
Figure 3
Figure 3. Chromatin becomes highly dispersed into a mesh of 10 nm fibres between four- and eight-cell stage embryos, with high levels of RNPs in the intervening nucleoplasmic space.
(A), Fluorescence image of a DAPI stained nucleus of a four-cell embryo. (B), low magnification mass image of cell from four-cell embryo (nuclear periphery highlighted with dotted line). Field from boxed region (B) showing phosphorus and nitrogen maps (C,D), nitrogen map after phosphorus subtraction merged with phosphorus map (E). Nuclear pores are indicated (arrowheads, E), nucleolar precursor body (NPB). Higher magnification phosphorus map (F) and merged with nitrogen (G) of a field from region shown in C–E. DCh, dispersed chromatin; CCh, compact chromatin blocks. H, higher magnification of a field from region in F,G. Fields delineated with dotted lines (F,H) contain RNP structures, characterized by phosphorus-rich granules, but of a lower phosphorus to nitrogen ratio than chromatin fibres. Arrowheads (H) indicate 10 nm chromatin fibres. (I), Fluorescence image of a DAPI stained nucleus of an eight-cell embryo. (J), low magnification mass image of a cell from eight-cell embryo (nuclear periphery highlighted with dotted line). K, field shown in J of the merge of phosphorus and nitrogen signals. L, high magnification of field in K. Arrows serve as fiduciaries between K, L and M, and also indicate two nuclear pores. Area indicated with dotted lines shows high concentration of RNPs in nucleoplasm (L). M, high magnification of field in L. Arrowheads indicate 10 nm chromatin fibres in compact chromatin region at nuclear envelope. Scale bars in A and I represents 5 µm. Scale bar in C represents 500 nm (C–E), 250 nm (F,G) and 125 nm (H). Scale bar in K represents 500 nm (K), 250 nm (L) and 125 nm (M).
Figure 4
Figure 4. Chromatin is highly dispersed in pluripotent cell nuclei of E3.5 blastocysts, but more compact in lineage-committed cells.
Left panels show fluorescence microscopy of physical sections (70 nm thickness) of E3.5 blastocysts immuno-labelled for Nanog (A, epiblast), Gata6 (B, primitive endoderm) and Cdx2 (C, polar and mural trophectoderm). Although auto-fluorescence was detected in the nucleolus of some cells, this does not impact the ability to distinguish between nuclei that are positive or negative for Cdx2/Gata6. Positive cells are indicated by arrows in each image. Panels in the second column show low magnification mass-sensitive image of a positive cell. Merged phosphorus and nitrogen maps of the area indicated in the mass-sensitive images are shown at two magnifications in the right-side panels. 10 nm chromatin fibres are prevalent in epiblast (arrows) whereas blocks of compact chromatin (arrowheads) with fewer dispersed 10 nm fibres are observed in extra-embryonic progenitor cells. (D), Fluorescence images of DAPI stained nuclei of epiblast (left) and trophoblast (right) cells of a E3.5 blastocyst (scale bar represents 5 µm). (E), Chromatin compaction was quantified by measuring the distribution of chromatin cluster size in each cell type (see materials and methodsfor details). PE and polar TE cells contain larger chromatin clusters than EPI cells, suggesting that lineage-restricted cells have a more condensed chromatin architecture than pluripotent cells.
Figure 5
Figure 5. Chromatin forms compact domains along the nuclear envelope and throughout the nucleoplasm in embryonic and extra-embryonic progenitors at E5.5.
Low magnification fluorescence micrograph (upper left) of E5.5 embryo, showing EPI and extra-embryonic ectoderm (ExE). Low magnification mass-sensitive image of (a) EPI and (b) ExE. Merged phosphorus and nitrogen maps of the indicated fields in (a) and (b) are shown at two magnifications. In both EPI and ExE, chromatin accumulates into compact rim along the nuclear envelope (arrowheads) and in compact blocks at the nuclear envelope and throughout the nucleoplasm (arrows) with little dispersed 10 nm chromatin visible between the compact chromatin domains.
Figure 6
Figure 6. Loss of pluripotency results in chromatin compaction in epiblast cells.
Left panels show fluorescence microscopy of Oct4 immuno-labelled embryos; wildtype Oct4+/+, heterozygous Oct4−/+ (A), and null mutants Oct4−/− (B). Panels in the second column show low magnification mass-sensitive image of the area indicated in fluorescence images. Merged phosphorus and nitrogen maps are shown in the right panels. Panels labelled 3 and 4 are from a separate null embryo (not shown). Epiblast cells in control embryos have a thin rim of chromatin on nuclear membrane (arrowheads in A 1,2), whereas Oct4−/− mutant epiblast cells showed greater accumulation of chromatin at the nuclear periphery (arrowheads in B 1,2). Arrows in B indicate large blocks of compact chromatin, a structure rarely observed in control epiblast nuclei. C, Chromatin compaction was quantified by measuring the distribution of chromatin cluster size in Oct4 mutant and control embryos (see materials and methodsfor details). Cells within Oct4−/− embryos contained larger chromatin clusters than in control cells, suggesting that loss of Oct4 leads to increased chromatin compaction levels. Scale bar represents 500 nm in merged images.
Figure 7
Figure 7. Global chromatin architecture in in vitro stem cell populations is similar to their in vivo counterparts in the embryo.
ESI images of stem cells are shown in the left column (embryonic stem cells (ES), epiblast stem cells (EpiSCs), trophectoderm stem cells (TS), and extra-embryonic endoderm (XEN). ESI of nuclei of embryo stages from which the stem cells were derived are shown in the right column (E3.5 epiblast, E5.5 epiblast, E5.5 extra-embryonic ectoderm, E3.5 primitive endoderm). Chromatin (yellow) and protein and RNPs (shades of blue) are determined from nitrogen and phosphorus maps. Scale bar represents 500 nm.
Figure 8
Figure 8. Major changes in nuclear and global chromatin structure occur in nuclei from the zygote to the E5.5 postimplantation stage embryo.

References

    1. Rossant J, Tam PP. Blastocyst lineage formation, early embryonic asymmetries and axis patterning in the mouse. Development. 2009;136:701–713. - PubMed
    1. Smith AG. Embryo-derived stem cells: of mice and men. Annu Rev Cell Dev Biol. 2001;17:435–462. - PubMed
    1. Beato M, Eisfeld K. Transcription factor access to chromatin. Nucleic Acids Res. 1997;25:3559–3563. - PMC - PubMed
    1. Kornberg RD, Lorch Y. Irresistible force meets immovable object: transcription and the nucleosome. Cell. 1991;67:833–836. - PubMed
    1. Kornberg RD, Lorch Y. Chromatin structure and transcription. Annu Rev Cell Biol. 1992;8:563–587. - PubMed

Publication types

LinkOut - more resources