

ETS transcription factors control transcription of EZH2 and epigenetic silencing of the tumor suppressor gene Nkx3.1 in prostate cancer
- PMID: 20479932
- PMCID: PMC2866657
- DOI: 10.1371/journal.pone.0010547
ETS transcription factors control transcription of EZH2 and epigenetic silencing of the tumor suppressor gene Nkx3.1 in prostate cancer
Abstract
Background: ETS transcription factors regulate important signaling pathways involved in cell differentiation and development in many tissues and have emerged as important players in prostate cancer. However, the biological impact of ETS factors in prostate tumorigenesis is still debated.
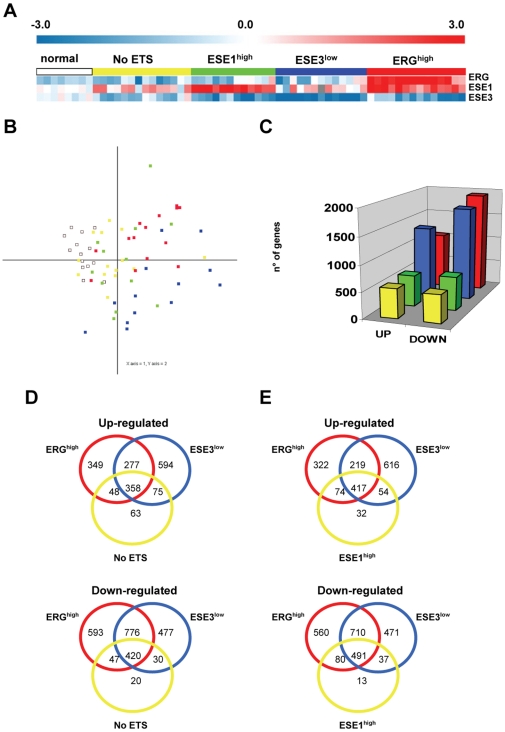
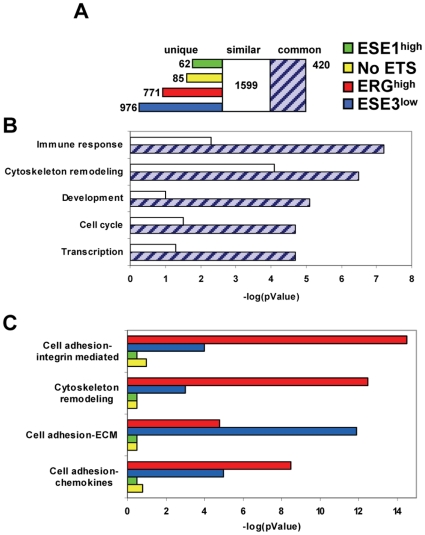
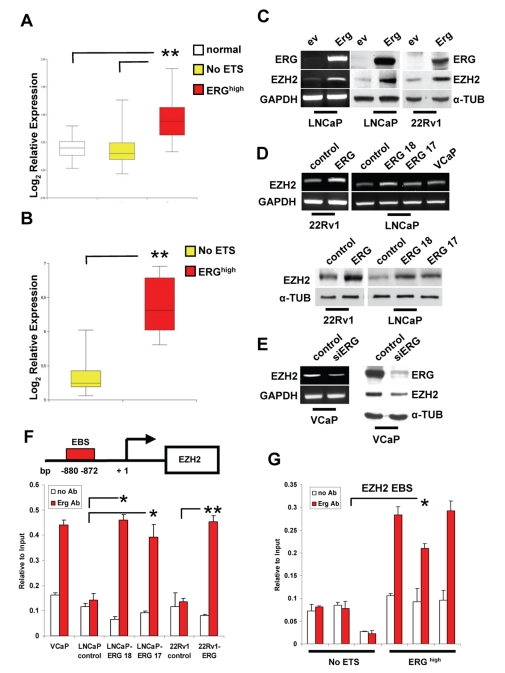
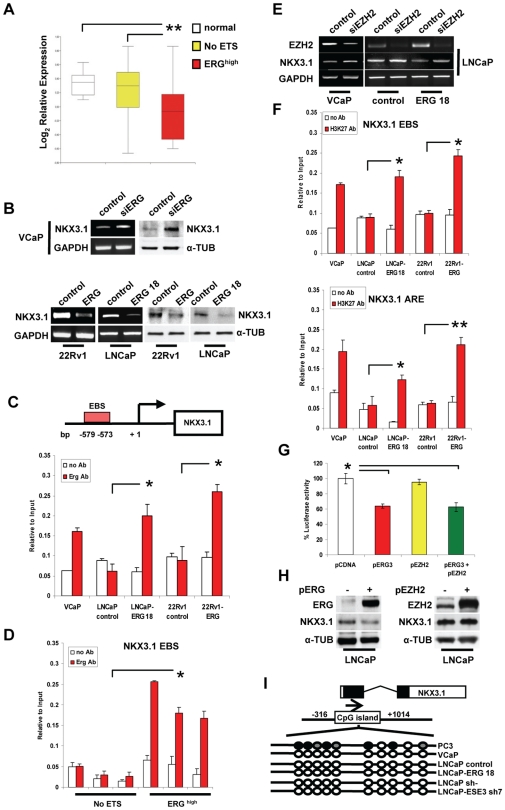
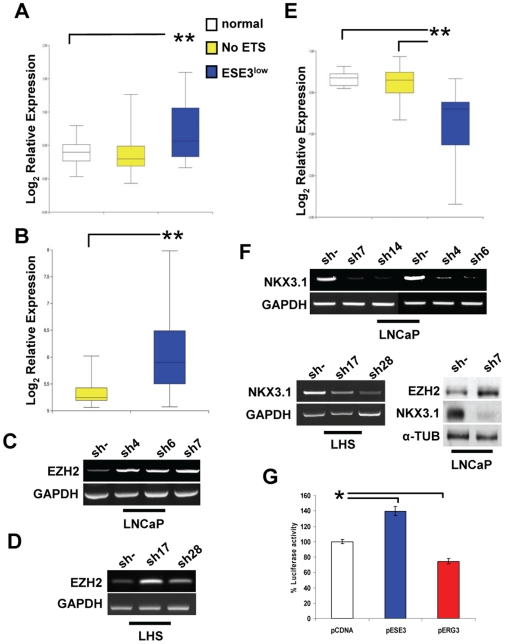
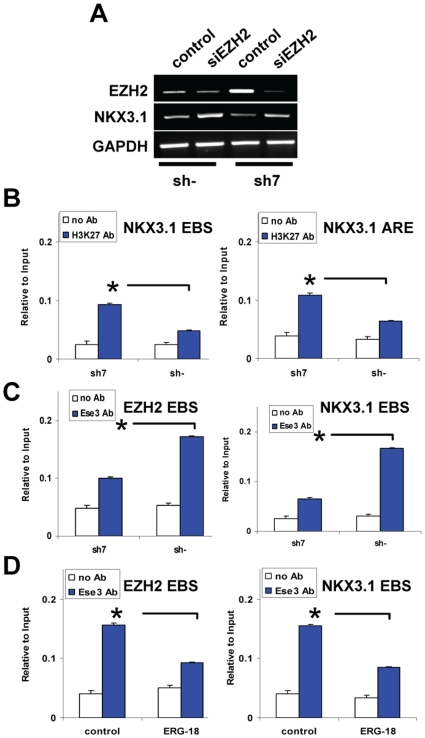
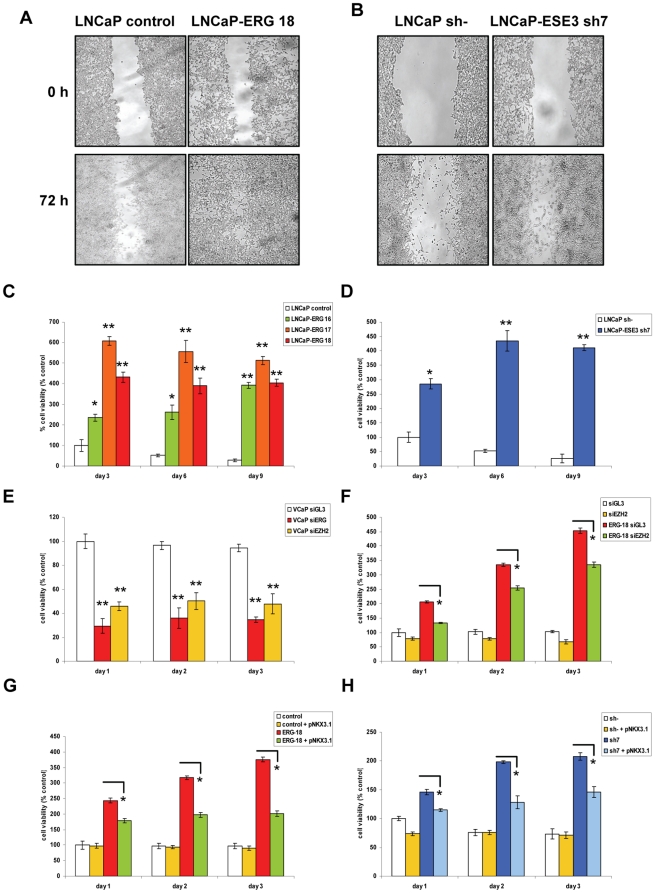
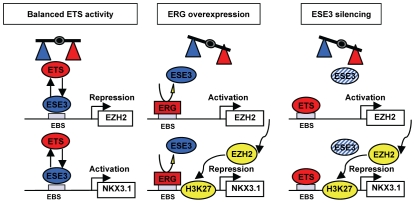
Methodology/principal findings: We performed an analysis of the ETS gene family using microarray data and real-time PCR in normal and tumor tissues along with functional studies in normal and cancer cell lines to understand the impact in prostate tumorigenesis and identify key targets of these transcription factors. We found frequent dysregulation of ETS genes with oncogenic (i.e., ERG and ESE1) and tumor suppressor (i.e., ESE3) properties in prostate tumors compared to normal prostate. Tumor subgroups (i.e., ERG(high), ESE1(high), ESE3(low) and NoETS tumors) were identified on the basis of their ETS expression status and showed distinct transcriptional and biological features. ERG(high) and ESE3(low) tumors had the most robust gene signatures with both distinct and overlapping features. Integrating genomic data with functional studies in multiple cell lines, we demonstrated that ERG and ESE3 controlled in opposite direction transcription of the Polycomb Group protein EZH2, a key gene in development, differentiation, stem cell biology and tumorigenesis. We further demonstrated that the prostate-specific tumor suppressor gene Nkx3.1 was controlled by ERG and ESE3 both directly and through induction of EZH2.
Conclusions/significance: These findings provide new insights into the role of the ETS transcriptional network in prostate tumorigenesis and uncover previously unrecognized links between aberrant expression of ETS factors, deregulation of epigenetic effectors and silencing of tumor suppressor genes. The link between aberrant ETS activity and epigenetic gene silencing may be relevant for the clinical management of prostate cancer and design of new therapeutic strategies.
Conflict of interest statement
Figures
Similar articles
-
Molecular subtyping of primary prostate cancer reveals specific and shared target genes of different ETS rearrangements.Neoplasia. 2012 Jul;14(7):600-11. doi: 10.1593/neo.12600. Neoplasia. 2012. PMID: 22904677 Free PMC article.
-
Genetic interaction between Tmprss2-ERG gene fusion and Nkx3.1-loss does not enhance prostate tumorigenesis in mouse models.PLoS One. 2015 Mar 17;10(3):e0120628. doi: 10.1371/journal.pone.0120628. eCollection 2015. PLoS One. 2015. PMID: 25780911 Free PMC article.
-
Suppression of CHK1 by ETS Family Members Promotes DNA Damage Response Bypass and Tumorigenesis.Cancer Discov. 2015 May;5(5):550-63. doi: 10.1158/2159-8290.CD-13-1050. Epub 2015 Feb 4. Cancer Discov. 2015. PMID: 25653093 Free PMC article.
-
[Molecular aspects of prostate cancer: recent data from the literature].Bull Cancer. 2007 Jul;94(7 Suppl):F77-88. Bull Cancer. 2007. PMID: 17845997 Review. French.
-
The oncogenic role of the ETS transcription factors MEF and ERG.Cell Cycle. 2010 Sep 1;9(17):3457-9. doi: 10.4161/cc.9.17.13000. Epub 2010 Sep 13. Cell Cycle. 2010. PMID: 20814243 Free PMC article. Review.
Cited by
-
Molecular pathogenesis and progression of prostate cancer.Semin Oncol. 2013 Jun;40(3):244-58. doi: 10.1053/j.seminoncol.2013.04.001. Semin Oncol. 2013. PMID: 23806491 Free PMC article. Review.
-
The role of chromodomain helicase DNA binding protein 1 (CHD1) in promoting an invasive prostate cancer phenotype.Ther Adv Urol. 2021 Aug 4;13:17562872211022462. doi: 10.1177/17562872211022462. eCollection 2021 Jan-Dec. Ther Adv Urol. 2021. PMID: 34408788 Free PMC article.
-
The ETS factor ESE3/EHF represses IL-6 preventing STAT3 activation and expansion of the prostate cancer stem-like compartment.Oncotarget. 2016 Nov 22;7(47):76756-76768. doi: 10.18632/oncotarget.12525. Oncotarget. 2016. PMID: 27732936 Free PMC article.
-
Modulation of the activity of Sp transcription factors by mithramycin analogues as a new strategy for treatment of metastatic prostate cancer.PLoS One. 2012;7(4):e35130. doi: 10.1371/journal.pone.0035130. Epub 2012 Apr 19. PLoS One. 2012. PMID: 22545098 Free PMC article.
-
MicroRNA-424 impairs ubiquitination to activate STAT3 and promote prostate tumor progression.J Clin Invest. 2016 Dec 1;126(12):4585-4602. doi: 10.1172/JCI86505. Epub 2016 Nov 7. J Clin Invest. 2016. PMID: 27820701 Free PMC article.
References
-
- Tomlins SA, Rhodes DR, Perner S, Dhanasekaran SM, Mehra R, et al. Recurrent fusion of TMPRSS2 and ETS transcription factor genes in prostate cancer. Science. 2005;310:644–648. - PubMed
-
- Tomlins SA, Laxman B, Dhanasekaran SM, Helgeson BE, Cao X, et al. Distinct classes of chromosomal rearrangements create oncogenic ETS gene fusions in prostate cancer. Nature. 2007;448:595–599. - PubMed
Publication types
MeSH terms
Substances
LinkOut - more resources
Full Text Sources
Other Literature Sources
Medical
Molecular Biology Databases
