

Anthracenedione derivatives as anticancer agents isolated from secondary metabolites of the mangrove endophytic fungi
- PMID: 20479985
- PMCID: PMC2866493
- DOI: 10.3390/md8041469
Anthracenedione derivatives as anticancer agents isolated from secondary metabolites of the mangrove endophytic fungi
Abstract
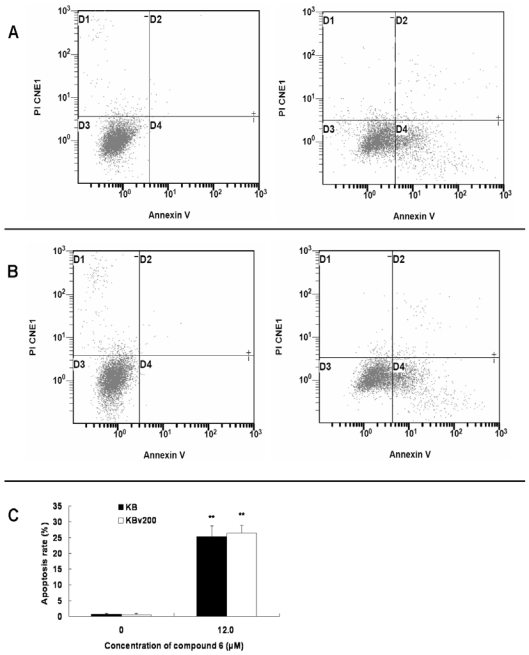
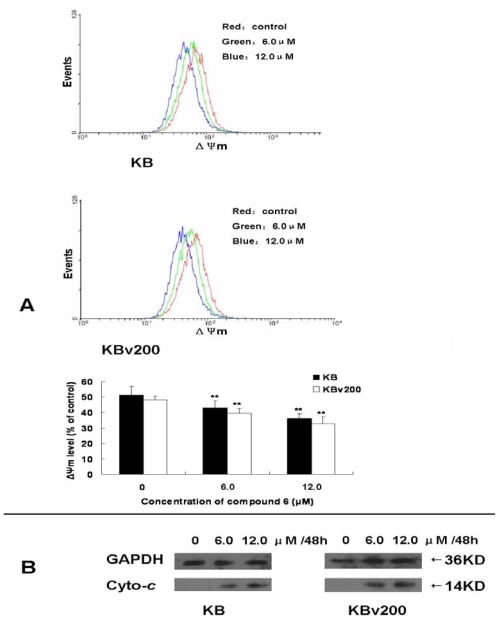
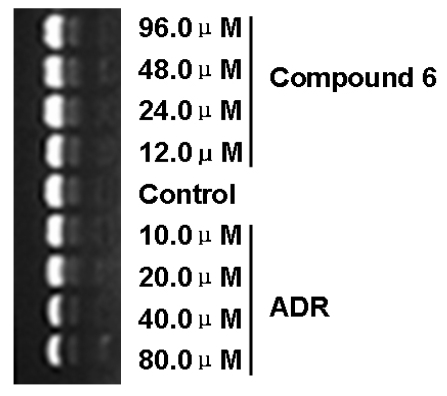
In this article, we report anticancer activity of 14 anthracenedione derivatives separated from the secondary metabolites of the mangrove endophytic fungi Halorosellinia sp. (No. 1403) and Guignardia sp. (No. 4382). Some of them inhibited potently the growth of KB and KBv200 cells, among which compound 6 displayed strong cytotoxicity with IC(50) values of 3.17 and 3.21 microM to KB and KBv200 cells, respectively. Furthermore, we demonstrate that the mechanism involved in the apoptosis induced by compound 6 is probably related to mitochondrial dysfunction. Additionally, the structure-activity relationships of these compounds are discussed.
Keywords: anthracenedione derivatives; anticancer; apoptosis; mangrove endophytic fungi; structure-activity relationship.
Figures


Similar articles
-
Anticancer activity and mechanism investigation of beauvericin isolated from secondary metabolites of the mangrove endophytic fungi.Anticancer Agents Med Chem. 2015;15(2):258-66. doi: 10.2174/1871520614666140825112255. Anticancer Agents Med Chem. 2015. PMID: 25641103
-
Anthracenedione derivative 1403P-3 induces apoptosis in KB and KBv200 cells via reactive oxygen species-independent mitochondrial pathway and death receptor pathway.Cancer Biol Ther. 2007 Sep;6(9):1413-21. doi: 10.4161/cbt.6.9.4543. Epub 2007 Jun 5. Cancer Biol Ther. 2007. PMID: 17786034
-
Anticancer effect and structure-activity analysis of marine products isolated from metabolites of mangrove fungi in the South China Sea.Mar Drugs. 2010 Apr 1;8(4):1094-105. doi: 10.3390/md8041094. Mar Drugs. 2010. PMID: 20479969 Free PMC article.
-
[Research advances in endophytic fungi of mangrove].Ying Yong Sheng Tai Xue Bao. 2007 Apr;18(4):912-8. Ying Yong Sheng Tai Xue Bao. 2007. PMID: 17615893 Review. Chinese.
-
Putative Anticancer Compounds from Plant-Derived Endophytic Fungi: A Review.Molecules. 2022 Jan 4;27(1):296. doi: 10.3390/molecules27010296. Molecules. 2022. PMID: 35011527 Free PMC article. Review.
Cited by
-
Bioactive Microbial Metabolites in Cancer Therapeutics: Mining, Repurposing, and Their Molecular Targets.Curr Microbiol. 2022 Aug 24;79(10):300. doi: 10.1007/s00284-022-02990-7. Curr Microbiol. 2022. PMID: 36002695 Review.
-
Three bianthraquinone derivatives from the mangrove endophytic fungus Alternaria sp. ZJ9-6B from the South China Sea.Mar Drugs. 2011;9(5):832-843. doi: 10.3390/md9050832. Epub 2011 May 12. Mar Drugs. 2011. PMID: 21673892 Free PMC article.
-
Danthron, an Anthraquinone Isolated from a Marine Fungus, Is a New Inhibitor of Angiogenesis Exhibiting Interesting Antitumor and Antioxidant Properties.Antioxidants (Basel). 2023 May 15;12(5):1101. doi: 10.3390/antiox12051101. Antioxidants (Basel). 2023. PMID: 37237967 Free PMC article.
-
Bruceine D induces apoptosis in human chronic myeloid leukemia K562 cells via mitochondrial pathway.Am J Cancer Res. 2016 Mar 15;6(4):819-26. eCollection 2016. Am J Cancer Res. 2016. PMID: 27186433 Free PMC article.
-
Expression of PDK1 in malignant pheochromocytoma as a new promising potential therapeutic target.Clin Transl Oncol. 2019 Oct;21(10):1312-1318. doi: 10.1007/s12094-019-02055-5. Epub 2019 Feb 13. Clin Transl Oncol. 2019. PMID: 30759304
References
-
- Ruefli AA, Tainton KM, Darcy PK, Smyth MJ, Johnstone RW. P-glycoprotein inhibits caspase-8 activation but not formation of the death inducing signal complex (disc) following Fas ligation. Cell Death Differ. 2002;9:1266–1272. - PubMed
-
- Shi Z, Peng XX, Kim IW, Shukla S, Si QS, Robey RW, Bates SE, Shen T, Ashby CR, Jr, Fu LW, Ambudkar SV, Chen ZS. Erlotinib (Tarceva, OSI-774) antagonizes ATP-binding cassette subfamily B member 1 and ATP-binding cassette subfamily G member 2-mediated drug resistance. Cancer Res. 2007;67:11012–11020. - PubMed
-
- D’Incalci M, Simone M, Tavecchio M, Damia G, Garbi A, Erba E. New drugs from the sea. J Chemother. 2004;16(Suppl 4):86–89. - PubMed
Publication types
MeSH terms
Substances
LinkOut - more resources
Full Text Sources
Other Literature Sources
Medical