

Challenge to the charging model of semiconductor-nanocrystal fluorescence intermittency from off-state quantum yields and multiexciton blinking
- PMID: 20482016
- PMCID: PMC3351081
- DOI: 10.1103/PhysRevLett.104.157403
Challenge to the charging model of semiconductor-nanocrystal fluorescence intermittency from off-state quantum yields and multiexciton blinking
Abstract
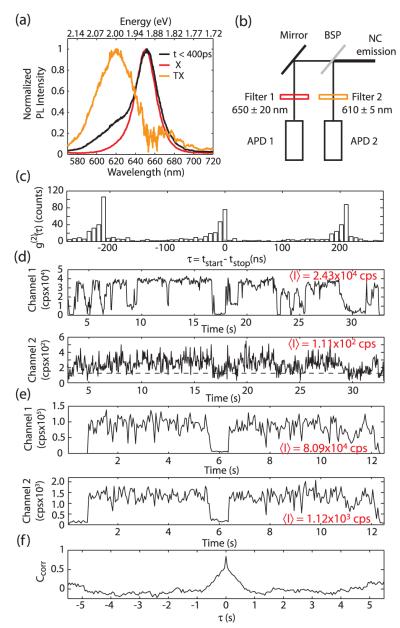
Semiconductor nanocrystals emit light intermittently; i.e., they "blink," under steady illumination. The dark periods have been widely assumed to be due to photoluminescence (PL) quenching by an Auger-like process involving a single additional charge present in the nanocrystal. Our results challenge this long-standing assumption. Close examination of exciton PL intensity time traces of single CdSe(CdZnS) core(shell) nanocrystals reveals that the dark state PL quantum yield can be 10 times less than the biexciton PL quantum yield. In addition, we observe spectrally resolved multiexciton emission and find that it also blinks with an on/off ratio greater than 10:1. These results directly contradict the predictions of the charging model.
Figures


References
-
- Nirmal M, et al. Nature (London) 1996;383:802.
-
- Empedocles SA, et al. Adv. Mater. 1999;11:1243.
-
- Coe-Sullivan S, et al. Nature (London) 2002;420:800.
-
- Zhao J, et al. Nano Lett. 2006;6:463. - PubMed
-
- Anikeeva PO, et al. Phys. Rev. B. 2008;78:085434.
Publication types
MeSH terms
Grants and funding
LinkOut - more resources
Full Text Sources
Other Literature Sources