

Reporting on covariate adjustment in randomised controlled trials before and after revision of the 2001 CONSORT statement: a literature review
- PMID: 20482769
- PMCID: PMC2886040
- DOI: 10.1186/1745-6215-11-59
Reporting on covariate adjustment in randomised controlled trials before and after revision of the 2001 CONSORT statement: a literature review
Abstract
Objectives: To evaluate the use and reporting of adjusted analysis in randomised controlled trials (RCTs) and compare the quality of reporting before and after the revision of the CONSORT Statement in 2001.
Design: Comparison of two cross sectional samples of published articles.
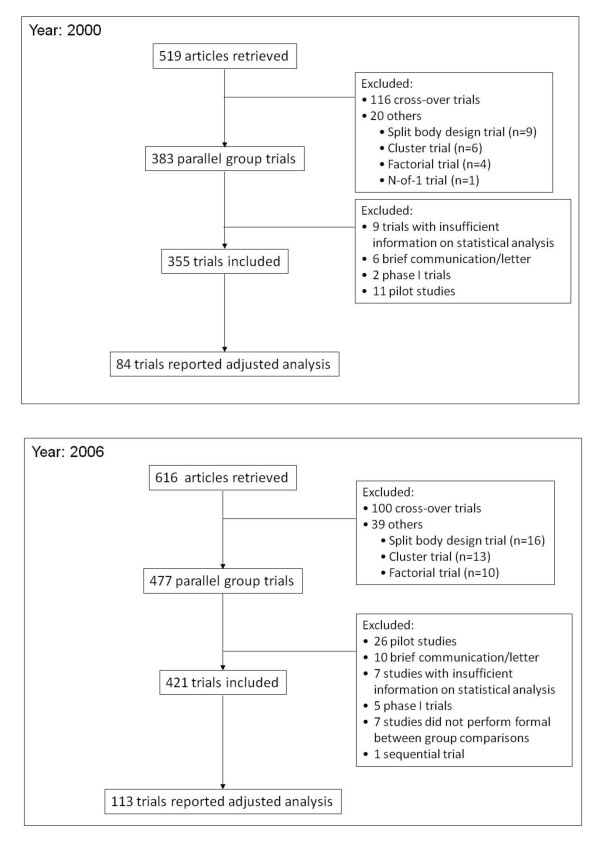
Data sources: Journal articles indexed on PubMed in December 2000 and December 2006.
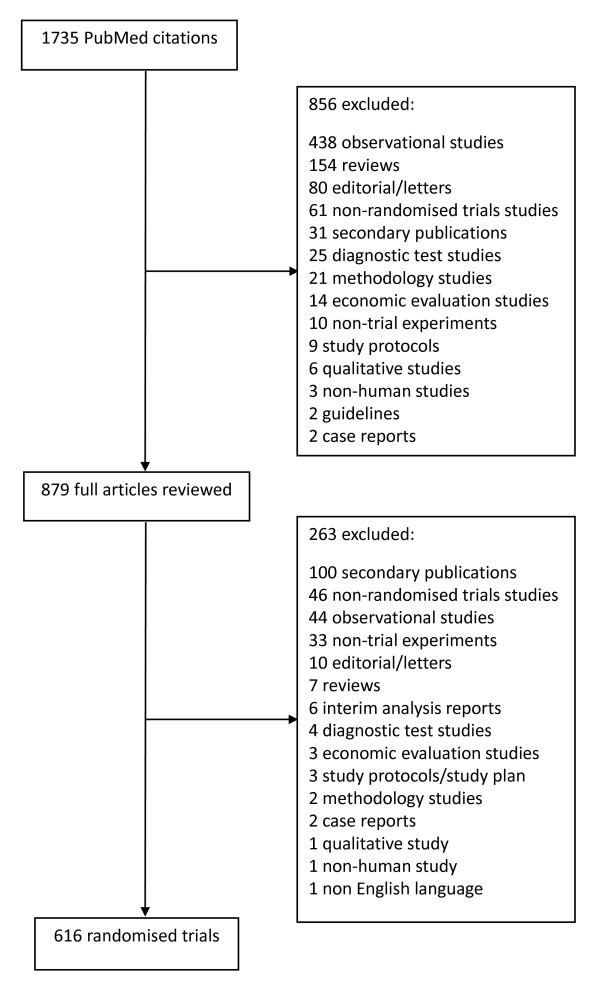
Study selection: Parallel group RCTs with a full publication carried out in humans and published in English
Main outcome measures: Proportion of articles reported adjusted analysis; use of adjusted analysis; the reason for adjustment; the method of adjustment and the reporting of adjusted analysis results in the main text and abstract.
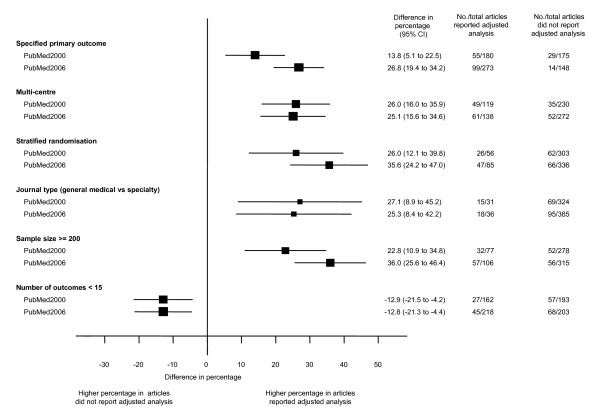
Results: In both cohorts, 25% of studies reported adjusted analysis (84/355 in 2000 vs 113/422 in 2006). Compared with articles reporting only unadjusted analyses, articles that reported adjusted analyses were more likely to specify primary outcomes, involve multiple centers, perform stratified randomization, be published in general medical journals, and recruit larger sample sizes. In both years a minority of articles explained why and how covariates were selected for adjustment (20% to 30%). Almost all articles specified the statistical methods used for adjustment (99% in 2000 vs 100% in 2006) but only 5% and 10%, respectively, reported both adjusted and unadjusted results as recommended in the CONSORT guidelines.
Conclusion: There was no evidence of change in the reporting of adjusted analysis results five years after the revision of the CONSORT Statement and only a few articles adhered fully to the CONSORT recommendations.
Figures
References
-
- Altman DG. Comparability of randomised groups. Statistician. 1985;34:125–36. doi: 10.2307/2987510. - DOI
Publication types
MeSH terms
Grants and funding
LinkOut - more resources
Full Text Sources
