

Combined evaluation of bone marrow aspirate and biopsy is superior in the prognosis of multiple myeloma
- PMID: 20482792
- PMCID: PMC2883968
- DOI: 10.1186/1746-1596-5-30
Combined evaluation of bone marrow aspirate and biopsy is superior in the prognosis of multiple myeloma
Abstract
Background: Estimation of plasma cell infiltrates in bone marrow aspirates (BMA) and bone marrow biopsy (BMB) is a standard method in the diagnosis and monitoring of multiple myeloma (MM). Plasma cell fraction in the bone marrow is therefore critical for the classification and optimal clinical management of patients with plasma cell dyscrasias. The aim of the study was to compare the percentage of plasma cells obtained by both methods with the patient clinical parameters and survival.
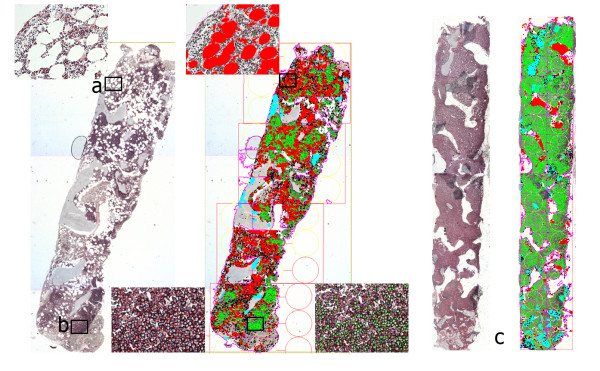
Methods: This retrospective study included BMA and BMB of 59 MM patients. The conventional differential count was determined in BMA to estimate the percentage and cytologic grade of plasma cells. The pattern of neoplastic infiltration and percentage of plasma cells were estimated on CD138 immunostained BMB slides microscopically and by computer-assisted image analysis (CIA).
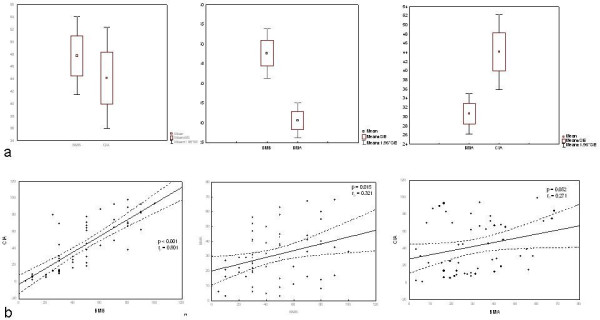
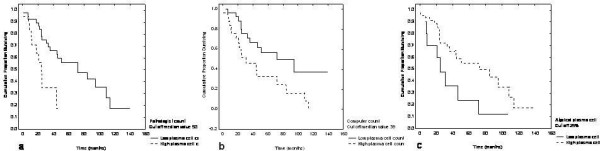
Results: Significantly higher values of plasma cell infiltrates were observed in pathologist (47.7 +/- 24.8) and CIA (44.1 +/- 30.6) reports in comparison with cytologist analysis (30.6 +/- 17.1; P < 0.001 and P < 0.0048, respectively). BMB assessment by pathologist counting and using CIA showed strongest correlation (r = 0.8; P < 0.0001). Correlation was also observed between the pathologist and cytologist counts (r = 0.321; P = 0.015) as well as comparing the percentage of plasma cells in BMA and CIA (r = 0.27; P = 0.05). Patients with clinical stage I/II had a significantly lower CIA plasma cell count than those with clinical stage III (P = 0.008). Overall survival was shorter in patients with more than 25% of atypical plasma cell morphology estimated in BMA (P = 0.05) and a higher percentage of tumor cell infiltrates estimated by the pathologist and CIA (P = 0.0341 and P = 0.013, respectively).
Conclusion: Study results suggested the combined analyses to be useful as a routine procedure to achieve more accurate and informative diagnostic data.
Figures
References
-
- Provan D, Singer CRJ, Baglin T. Oxford handbook of clinical haematology. Second. Oxford: Oxford University Press; 2006. p. 266.
-
- Swerdlow SH, Campo E, Harris NL. WHO Classification of Tumours of tumours of Haematopoietic and Lymphoid Tissues. 4. Lyon: IARC Press; 2008.
Publication types
MeSH terms
Substances
LinkOut - more resources
Full Text Sources
Other Literature Sources
Medical
Miscellaneous
