Assessment of hospital performance with a case-mix standardized mortality model using an existing administrative database in Japan
- PMID: 20482816
- PMCID: PMC2882385
- DOI: 10.1186/1472-6963-10-130
Assessment of hospital performance with a case-mix standardized mortality model using an existing administrative database in Japan
Abstract
Background: Few studies have examined whether risk adjustment is evenly applicable to hospitals with various characteristics and case-mix. In this study, we applied a generic prediction model to nationwide discharge data from hospitals with various characteristics.
Method: We used standardized data of 1,878,767 discharged patients provided by 469 hospitals from July 1 to October 31, 2006. We generated and validated a case-mix in-hospital mortality prediction model using 50/50 split sample validation. We classified hospitals into two groups based on c-index value (hospitals with c-index > or = 0.8; hospitals with c-index < 0.8) and examined differences in their characteristics.
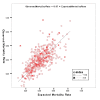
Results: The model demonstrated excellent discrimination as indicated by the high average c-index and small standard deviation (c-index = 0.88 +/- 0.04). Expected mortality rate of each hospital was highly correlated with observed mortality rate (r = 0.693, p < 0.001). Among the studied hospitals, 446 (95%) had a c-index of >/=0.8 and were classified as the higher c-index group. A significantly higher proportion of hospitals in the lower c-index group were specialized hospitals and hospitals with convalescent wards.
Conclusion: The model fits well to a group of hospitals with a wide variety of acute care events, though model fit is less satisfactory for specialized hospitals and those with convalescent wards. Further sophistication of the generic prediction model would be recommended to obtain optimal indices to region specific conditions.
Figures


Similar articles
-
Performance of in-hospital mortality prediction models for acute hospitalization: hospital standardized mortality ratio in Japan.BMC Health Serv Res. 2008 Nov 7;8:229. doi: 10.1186/1472-6963-8-229. BMC Health Serv Res. 2008. PMID: 18990251 Free PMC article.
-
Comparison of Epithor clinical national database and medico-administrative database to identify the influence of case-mix on the estimation of hospital outliers.PLoS One. 2019 Jul 24;14(7):e0219672. doi: 10.1371/journal.pone.0219672. eCollection 2019. PLoS One. 2019. PMID: 31339906 Free PMC article.
-
Risk-adjusting acute myocardial infarction mortality: are APR-DRGs the right tool?Health Serv Res. 2000 Mar;34(7):1469-89. Health Serv Res. 2000. PMID: 10737448 Free PMC article.
-
Development and testing of a systemic lupus-specific risk adjustment index for in-hospital mortality.J Rheumatol. 2000 Jun;27(6):1408-13. J Rheumatol. 2000. PMID: 10852262
-
Ranking Hospitals Based on Preventable Hospital Death Rates: A Systematic Review With Implications for Both Direct Measurement and Indirect Measurement Through Standardized Mortality Rates.Milbank Q. 2019 Mar;97(1):228-284. doi: 10.1111/1468-0009.12375. Milbank Q. 2019. PMID: 30883952 Free PMC article.
Cited by
-
Evaluating the Hospital Standardized Home-Transition Ratios for Cerebral Infarction in Japan: A Retrospective Observational Study from 2016 through 2020.Healthcare (Basel). 2022 Aug 13;10(8):1530. doi: 10.3390/healthcare10081530. Healthcare (Basel). 2022. PMID: 36011186 Free PMC article.
-
Impact of the COVID-19 pandemic on emergency admission for patients with stroke: a time series study in Japan.Neurol Res Pract. 2021 Dec 13;3(1):64. doi: 10.1186/s42466-021-00163-8. Neurol Res Pract. 2021. PMID: 34895353 Free PMC article.
-
Capturing the trends in hospital standardized mortality ratios for pneumonia: a retrospective observational study in Japan (2010 to 2018).Environ Health Prev Med. 2020 Jan 7;25(1):2. doi: 10.1186/s12199-019-0842-4. Environ Health Prev Med. 2020. PMID: 31910807 Free PMC article.
-
Hospital-level characteristics of the standardised mortality ratio for ischemic heart disease: a retrospective observational study using Japanese administrative claim data from 2012 to 2019.PeerJ. 2022 May 18;10:e13424. doi: 10.7717/peerj.13424. eCollection 2022. PeerJ. 2022. PMID: 35607450 Free PMC article.
References
-
- Iezzoni LI. Risk adjustment for measuring health care outcomes. Chicago, IL: Health Administration Press; 2003.
-
- Bradley EH, Herrin J, Elbel B, McNamara RL, Magid DJ, Nallamothu BK, Wang Y, Normand SL, Spertus JA, Krumholz HM. Hospital quality for acute myocardial infarction: correlation among process measures and relationship with short-term mortality. JAMA. 2006;296(1):72–78. doi: 10.1001/jama.296.1.72. - DOI - PubMed
-
- Krumholz HM, Wang Y, Mattera JA, Wang Y, Han LF, Ingber MJ, Roman S, Normand SL. An administrative claims model suitable for profiling hospital performance based on 30-day mortality rates among patients with an acute myocardial infarction. Circulation. 2006;113(13):1683–1692. doi: 10.1161/CIRCULATIONAHA.105.611186. - DOI - PubMed
-
- Motomura N, Miyata H, Tsukihara H, Takamoto S. Risk Model of Thoracic Aortic Surgery in 4707 Cases from a Nationwide Single-race Population, via a Web-based Data Entry System: The First Report of 30-day and 30-dayOperative Outcome Risk Models for Thoracic Aortic Surgery. Circulation. 2008;118:S153–9. doi: 10.1161/CIRCULATIONAHA.107.756684. - DOI - PubMed
Publication types
MeSH terms
LinkOut - more resources
Full Text Sources
Medical

