. 2010;11(5):R52.
doi: 10.1186/gb-2010-11-5-r52. Epub 2010 May 19.

Towards a comprehensive structural variation map of an individual human genome

Affiliations

Towards a comprehensive structural variation map of an individual human genome

Andy W Pang et al. Genome Biol. 2010.

Abstract

Background: Several genomes have now been sequenced, with millions of genetic variants annotated. While significant progress has been made in mapping single nucleotide polymorphisms (SNPs) and small (<10 bp) insertion/deletions (indels), the annotation of larger structural variants has been less comprehensive. It is still unclear to what extent a typical genome differs from the reference assembly, and the analysis of the genomes sequenced to date have shown varying results for copy number variation (CNV) and inversions.

Results: We have combined computational re-analysis of existing whole genome sequence data with novel microarray-based analysis, and detect 12,178 structural variants covering 40.6 Mb that were not reported in the initial sequencing of the first published personal genome. We estimate a total non-SNP variation content of 48.8 Mb in a single genome. Our results indicate that this genome differs from the consensus reference sequence by approximately 1.2% when considering indels/CNVs, 0.1% by SNPs and approximately 0.3% by inversions. The structural variants impact 4,867 genes, and >24% of structural variants would not be imputed by SNP-association.

Conclusions: Our results indicate that a large number of structural variants have been unreported in the individual genomes published to date. This significant extent and complexity of structural variants, as well as the growing recognition of their medical relevance, necessitate they be actively studied in health-related analyses of personal genomes. The new catalogue of structural variants generated for this genome provides a crucial resource for future comparison studies.


Figures

Figure 1
Figure 1
Overall workflow of the current study. Two distinct technologies were used to identify SV in the Venter genome: whole genome sequencing and genomic microarrays. The sequencing experiments, the construction of the Venter genome assembly, and the assembly comparison with NCBI build 36 (B36) reference had been completed in previous studies [1,16,39]. Hence, these experiments are shown as blue boxes. The scope of the current study is denoted in orange boxes. We re-analyzed the initial sequencing data, and searched for SVs in sequence alignments by the mate-pair and split-read approaches. We also used three distinct comparative genomic hybridization (CGH) array platforms: Agilent 24 M, NimbleGen 42 M and Agilent 244 K. Unlike the other array platforms, which were designed based on the B36 assembly, the Agilent 244 K targeted scaffold segments unique to the Celera/Venter assembly. To denote this, Figure 1 shows a dotted line connecting between the assembly comparison outcome and the Agilent 244 K box. Finally, the Affymetrix 6.0 and Illumina 1 M SNP arrays were also used in the present study.
Figure 2
Figure 2
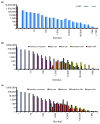
Size distribution of genetic variants. (a) A non-redundant size spectrum of SNP and CNV (including indels) and a breakdown of the proportion of gain to loss. The indel/CNV dataset consists of variants detected by assembly comparison, mate-pair, split-read, NimbleGen 42 M comparative genomic hybridization (CGH) and Agilent 24 M. The results show that the number and the size of variants are negatively correlated. Although the proportions of gains and losses are quite equal across the size spectrum, there are some deviations. Losses are more abundant in the 1 to 10 kb range, and this is mainly due to the inability of the 2-kb and 10-kb library mate-pair clones to detect insertions larger than their clone size. The opposite is seen for large events, where duplications are more common than deletions, which may be due to both biological and methodological biases. The increase in the number of events near 300 bp and 6 kb can be explained by short interspersed nuclear element (SINE) and long interspersed nuclear element (LINE) indels, respectively. The general peak around 10 kb corresponds to the interval with the highest clone coverage. (b) Size distribution of gains (insertions and duplications) highlighting the detection range of each methodology. The split-read method is designed to capture insertions from 11 bp to the size of a Sanger-based sequence read (approximately 1 kb). There is no insertion detected in the size range between the 2 kb and 10 kb library using the mate-pair approach. Furthermore, due to technical limitations, large gains (≥ 100,000 bp) cannot be identified with the sequencing-based approaches, while these are readily identified by microarrays. (c) Size distribution of deletions.
Figure 3
Figure 3
Agreement between the non-redundant set of Venter CNVs and genotype-validated variable loci. The agreement between sites identified by different detection methods was measured by the percentage of reciprocal overlap between the estimated size for the non-redundant set of Venter variants and the estimated size for the CNVs generated and genotyped in the Genome Structural Variation (GSV) population genetics study [19]. Two sites were considered overlapping if the reciprocal overlap among their estimated sizes was ≥ 50%. The lower right corner plot summarizes the mean discrepancy between Venter and GSV loci sizes, as a proportion of the GSV-estimated CNV size.
Figure 4
Figure 4
Difference in the size distributions of reported indels/CNVs in published personal genome sequencing studies. The graphs show variation found in a few personal genome sequencing studies [1-4,6-8]. These diagrams indicate that multiple approaches are needed for better detection of CNVs. Here, the total variant set in the Venter genome found in both the Levy et al. [1] and the current study is displayed. Unlike the current study where the size of mate-pair indels is equal to the difference between the mapping distance and the expected insert size, the SVs in the Ahn et al. [6] study are only based on the mapping distance. Besides the NGS data, we have also included the variants detected by the high density Agilent 24 M data in the Kim et al. [7] study. In Wheeler et al. [2], insertions identified by intra-read alignment would be limited by the size of the sequencing read; hence, large insertions beyond the read length were not detected. Wang et al. [4], Kim et al., and McKernan et al. [8] detected small variants based on split-reads and large ones based on mate-pairs and microarrays, but failed to detect variation between these size ranges. Also, see Additional file 1. (a) Insertion and duplication size distribution. (b) Deletion size distribution.
Figure 5
Figure 5
Tagging pattern for HuRef SVs as a function of its minimum allele frequency (MAF). Linkage disequilibrium is depicted as the best r2 between a SV and a HapMap SNP in 120 Europeans (CEU). There were a total of 405 bi-allelic polymorphic SV sites of overlap between GSV and HuRef loci; 24% of the SV loci have a HapMap SNP with r2 < 0.8 in CEU, a cutoff below which HuRef CNVs would not be imputed simply by SNP detection. The line graph corresponds to the left y-axis, while the bar graph corresponds to the right y-axis. It should be noted that this analysis is performed on a small subset of bi-allelic SVs and that the ability to impute a larger fraction of SVs based on common SNPs would be even lower.

Similar articles

Cited by

References

    1. Levy S, Sutton G, Ng PC, Feuk L, Halpern AL, Walenz BP, Axelrod N, Huang J, Kirkness EF, Denisov G, Lin Y, MacDonald JR, Pang AW, Shago M, Stockwell TB, Tsiamouri A, Bafna V, Bansal V, Kravitz SA, Busam DA, Beeson KY, McIntosh TC, Remington KA, Abril JF, Gill J, Borman J, Rogers YH, Frazier ME, Scherer SW, Strausberg RL. et al.The diploid genome sequence of an individual human. PLoS Biol. 2007;5:e254. doi: 10.1371/journal.pbio.0050254. - DOI - PMC - PubMed
    1. Wheeler DA, Srinivasan M, Egholm M, Shen Y, Chen L, McGuire A, He W, Chen YJ, Makhijani V, Roth GT, Gomes X, Tartaro K, Niazi F, Turcotte CL, Irzyk GP, Lupski JR, Chinault C, Song XZ, Liu Y, Yuan Y, Nazareth L, Qin X, Muzny DM, Margulies M, Weinstock GM, Gibbs RA, Rothberg JM. The complete genome of an individual by massively parallel DNA sequencing. Nature. 2008;452:872–876. doi: 10.1038/nature06884. - DOI - PubMed
    1. Bentley DR, Balasubramanian S, Swerdlow HP, Smith GP, Milton J, Brown CG, Hall KP, Evers DJ, Barnes CL, Bignell HR, Boutell JM, Bryant J, Carter RJ, Keira Cheetham R, Cox AJ, Ellis DJ, Flatbush MR, Gormley NA, Humphray SJ, Irving LJ, Karbelashvili MS, Kirk SM, Li H, Liu X, Maisinger KS, Murray LJ, Obradovic B, Ost T, Parkinson ML, Pratt MR. et al.Accurate whole human genome sequencing using reversible terminator chemistry. Nature. 2008;456:53–59. doi: 10.1038/nature07517. - DOI - PMC - PubMed
    1. Wang J, Wang W, Li R, Li Y, Tian G, Goodman L, Fan W, Zhang J, Li J, Zhang J, Guo Y, Feng B, Li H, Lu Y, Fang X, Liang H, Du Z, Li D, Zhao Y, Hu Y, Yang Z, Zheng H, Hellmann I, Inouye M, Pool J, Yi X, Zhao J, Duan J, Zhou Y, Qin J. et al.The diploid genome sequence of an Asian individual. Nature. 2008;456:60–65. doi: 10.1038/nature07484. - DOI - PMC - PubMed
    1. Ley TJ, Mardis ER, Ding L, Fulton B, McLellan MD, Chen K, Dooling D, Dunford-Shore BH, McGrath S, Hickenbotham M, Cook L, Abbott R, Larson DE, Koboldt DC, Pohl C, Smith S, Hawkins A, Abbott S, Locke D, Hillier LW, Miner T, Fulton L, Magrini V, Wylie T, Glasscock J, Conyers J, Sander N, Shi X, Osborne JR, Minx P. et al.DNA sequencing of a cytogenetically normal acute myeloid leukaemia genome. Nature. 2008;456:66–72. doi: 10.1038/nature07485. - DOI - PMC - PubMed

Publication types

MeSH terms