. 2010;11(5):R53.
doi: 10.1186/gb-2010-11-5-r53. Epub 2010 May 19.

A human functional protein interaction network and its application to cancer data analysis

Affiliations

A human functional protein interaction network and its application to cancer data analysis

Guanming Wu et al. Genome Biol. 2010.

Abstract

Background: One challenge facing biologists is to tease out useful information from massive data sets for further analysis. A pathway-based analysis may shed light by projecting candidate genes onto protein functional relationship networks. We are building such a pathway-based analysis system.

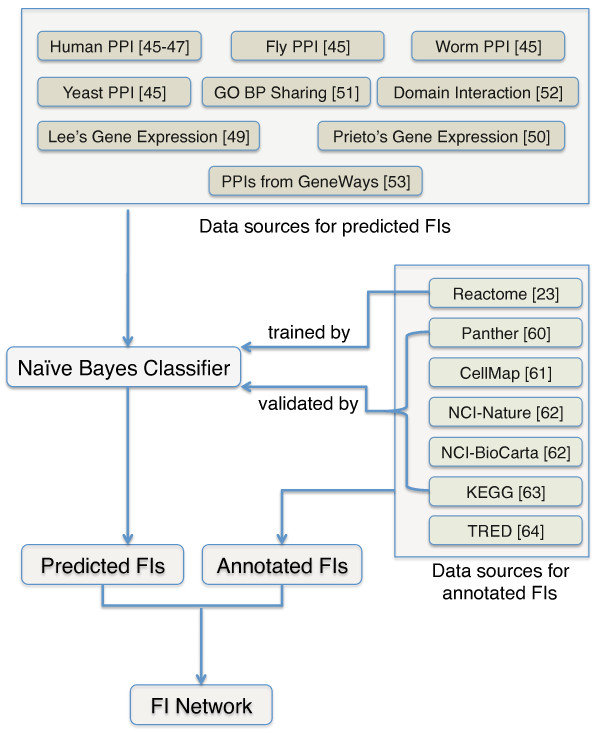
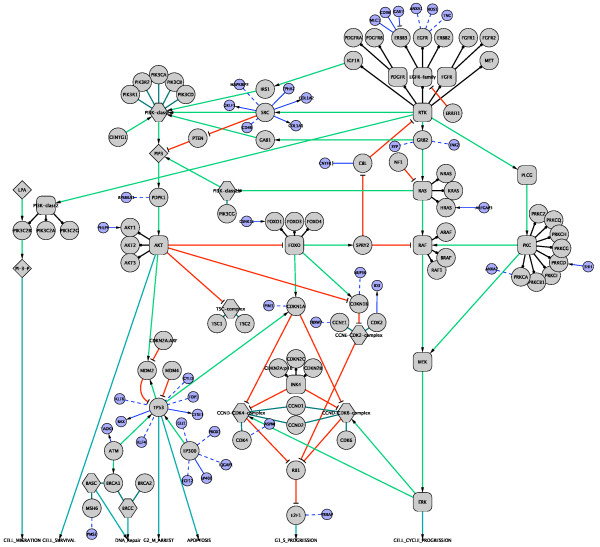
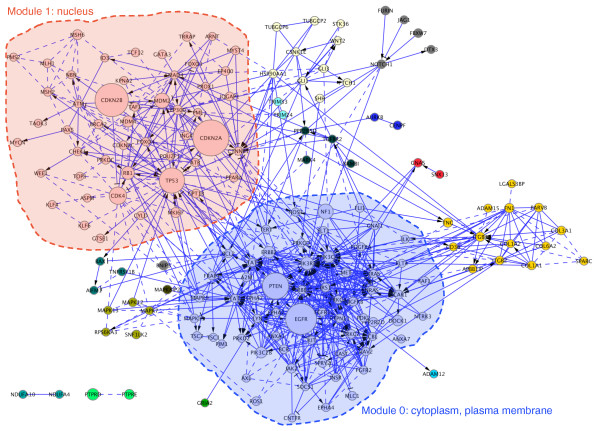
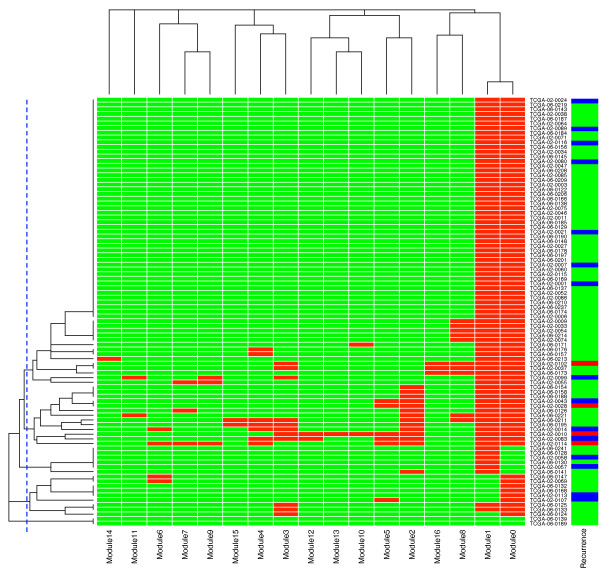
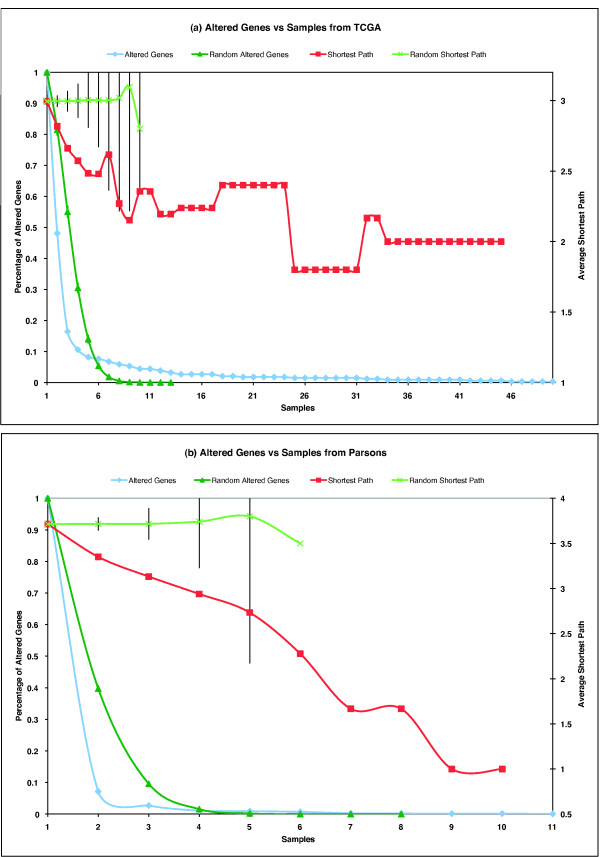
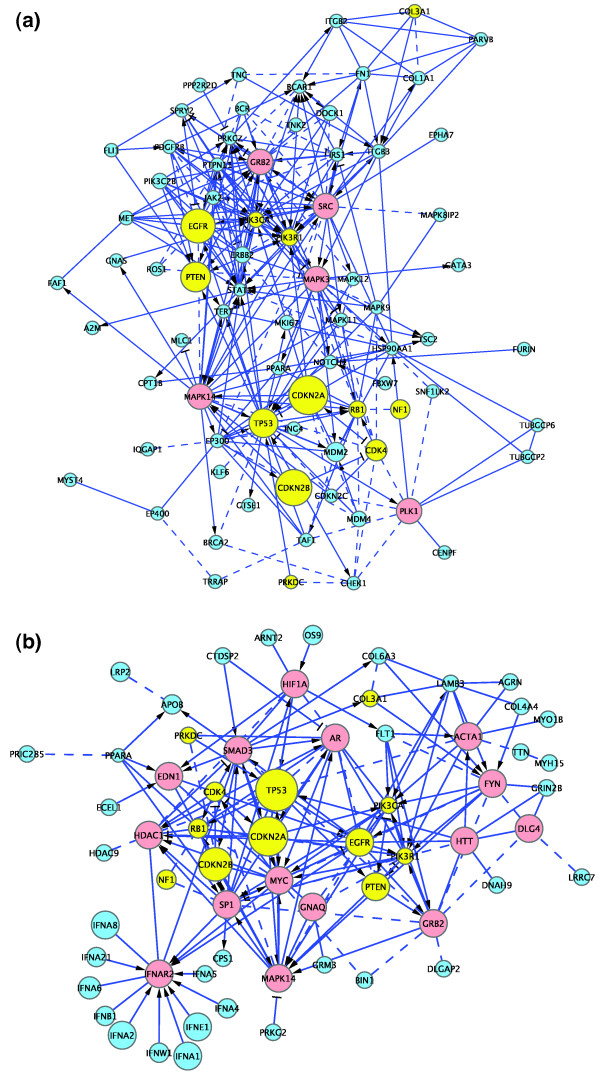
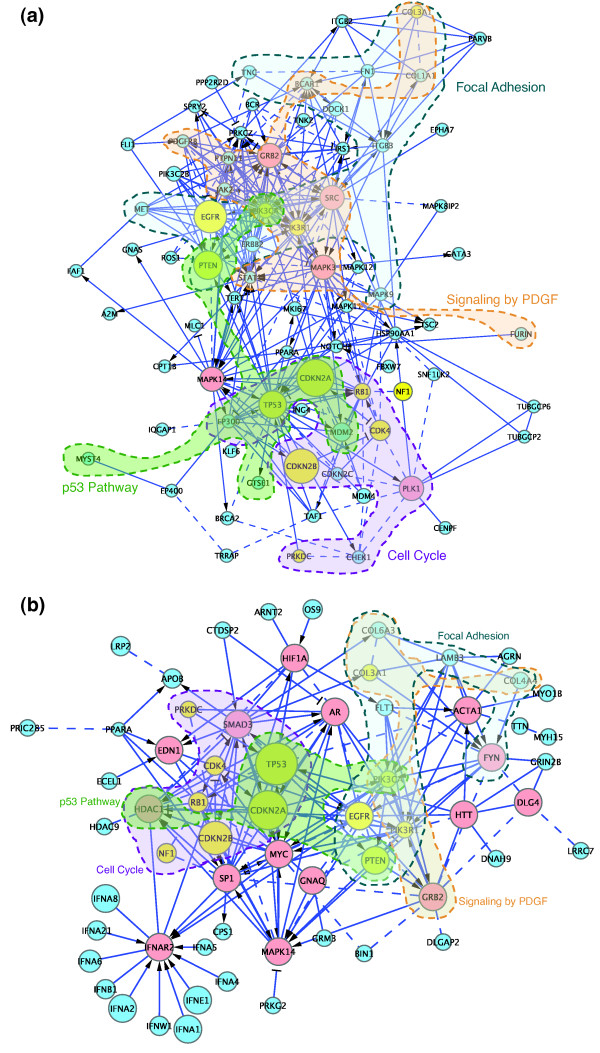
Results: We have constructed a protein functional interaction network by extending curated pathways with non-curated sources of information, including protein-protein interactions, gene coexpression, protein domain interaction, Gene Ontology (GO) annotations and text-mined protein interactions, which cover close to 50% of the human proteome. By applying this network to two glioblastoma multiforme (GBM) data sets and projecting cancer candidate genes onto the network, we found that the majority of GBM candidate genes form a cluster and are closer than expected by chance, and the majority of GBM samples have sequence-altered genes in two network modules, one mainly comprising genes whose products are localized in the cytoplasm and plasma membrane, and another comprising gene products in the nucleus. Both modules are highly enriched in known oncogenes, tumor suppressors and genes involved in signal transduction. Similar network patterns were also found in breast, colorectal and pancreatic cancers.

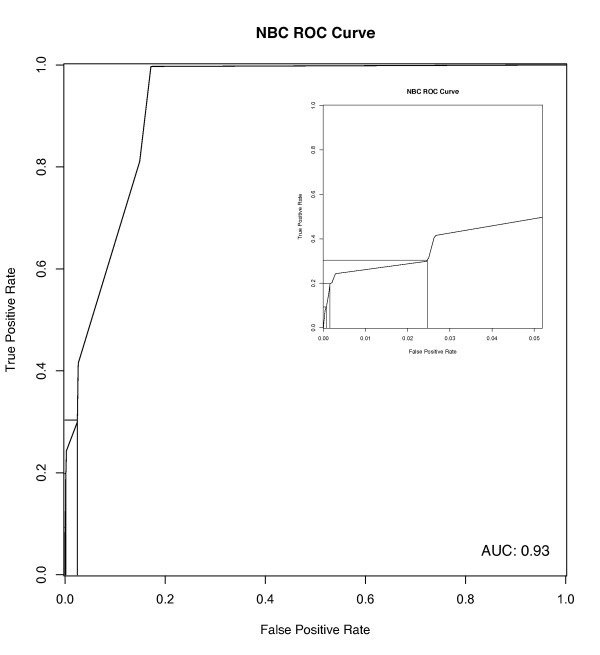
Conclusions: We have built a highly reliable functional interaction network upon expert-curated pathways and applied this network to the analysis of two genome-wide GBM and several other cancer data sets. The network patterns revealed from our results suggest common mechanisms in the cancer biology. Our system should provide a foundation for a network or pathway-based analysis platform for cancer and other diseases.


Figures

Figure 1
Figure 1
Overview of procedures used to construct the functional interaction network. See text for details. BP, biological process.
Figure 2
Figure 2
Receiver operating characteristic curve for NBC trained with protein pairs extracted from Reactome pathways as the positive data set, and random pairs as the negative data set. This curve was created using an independent test data set generated from pathways imported from non-Reactome pathway databases. The positions for the cutoff values 0.25, 0.50 and 0.75 are marked from right to left in the inset. The area under the curve (AUC) for this receiver operating characteristic (ROC) curve is 0.93.
Figure 3
Figure 3
Overlay of predicted functional interactions onto a human curated GBM pathway from the TCGA data set. Many genes can interact with multiple pathway genes. In this diagram, only genes interacting with one pathway gene are shown to minimize diagram clutter. Newly added genes are colored in light blue, while original genes are colored in grey. Newly added FIs are in blue, while original interactions are in other colors. FIs extracted from pathways are shown as solid lines (for example, PHLPP-AKT1), while those predicted based on NBC are shown as dashed lines (for example, KLF6-TP53). Extracted FIs involved in activation, expression regulation, or catalysis are shown with an arrowhead on the end of the line, while FIs involved in inhibition are shown with a 'T' bar. The original GBM pathway map in the Cytoscape format was downloaded from [69].
Figure 4
Figure 4
Edge-betweenness network clustering results for the altered genes from the TCGA data set. Gene nodes in different clusters are displayed in different colors. GO cellular component annotation for clusters 0 and 1 are labeled in the diagram to show the major cellular localizations for genes in these two clusters. The node size is proportional to the number of samples bearing displayed altered genes.
Figure 5
Figure 5
Hierarchical clustering of GBM samples in the TCGA data set based on altered gene occurrences in the network modules identified by the edge-betweenness algorithm. The rows are samples, while the columns are 17 network modules. In the central heat map, red rectangles represent samples having altered genes in modules, while green rectangles represent samples having no altered genes in modules. The vertical blue dashed line shows the cutoff value we used to select sample clusters from the hierarchical clustering. The right-most column lists sample types: green for primary GBM samples ('No' in Table S1B in [14]), blue for recurrent ones ('Rec' in Table S1B in [14]), and red for secondary ones ('Sec' in Table S1B in [14]).
Figure 6
Figure 6
Plots of altered genes versus samples. The horizontal axis is the sample numbers, and the left vertical axis is the percentage of altered genes occurring in samples related to total altered genes. The right vertical axis is the average shortest path among altered genes occurring in samples. (a) The TCGA data set. (b) The Parsons data set.
Figure 7
Figure 7
Subnetworks for GBM clusters. (a) The TCGA cluster. (b) The Parsons cluster. Shared GBM candidate genes are shown in yellow, non-shared candidate genes in aqua, and linker genes used to connect cancer genes in red. The node size is proportional to the number of samples bearing displayed altered genes. Other colors and symbols are as in Figure 2.
Figure 8
Figure 8
Subnetworks with pathways annotated for GBM clusters. Many pathways are hit by GBM candidate genes. Only four of them are labeled for two GBM clusters in this diagram to simplify the diagram. Colors and symbols are as in Figure 6.
Figure 9
Figure 9
Front page of the web application for predicted functional interactions.
Figure 10
Figure 10
Views of predicted functional interactions. (a) FIs in a reaction diagram. (b) FIs in a pathway diagram.

References

    1. Hanahan D, Weinberg RA. The hallmarks of cancer. Cell. 2000;100:57–70. doi: 10.1016/S0092-8674(00)81683-9. - DOI - PubMed
    1. Vogelstein B, Kinzler KW. Cancer genes and the pathways they control. Nat Med. 2004;10:789–799. doi: 10.1038/nm1087. - DOI - PubMed
    1. Itoh S, Itoh F, Goumans MJ, Ten Dijke P. Signaling of transforming growth factor-beta family members through Smad proteins. Eur J Biochem. 2000;267:6954–6967. doi: 10.1046/j.1432-1327.2000.01828.x. - DOI - PubMed
    1. Massagué J. TGFbeta in cancer. Cell. 2008;134:215–230. doi: 10.1016/j.cell.2008.07.001. - DOI - PMC - PubMed
    1. Dumont N, Arteaga CL. Transforming growth factor-beta and breast cancer: Tumor promoting effects of transforming growth factor-beta. Breast Cancer Res. 2000;2:125–132. doi: 10.1186/bcr44. - DOI - PMC - PubMed

Publication types

Substances

LinkOut - more resources