

Functional enrichment analyses and construction of functional similarity networks with high confidence function prediction by PFP
- PMID: 20482861
- PMCID: PMC2882935
- DOI: 10.1186/1471-2105-11-265
Functional enrichment analyses and construction of functional similarity networks with high confidence function prediction by PFP
Abstract
Background: A new paradigm of biological investigation takes advantage of technologies that produce large high throughput datasets, including genome sequences, interactions of proteins, and gene expression. The ability of biologists to analyze and interpret such data relies on functional annotation of the included proteins, but even in highly characterized organisms many proteins can lack the functional evidence necessary to infer their biological relevance.
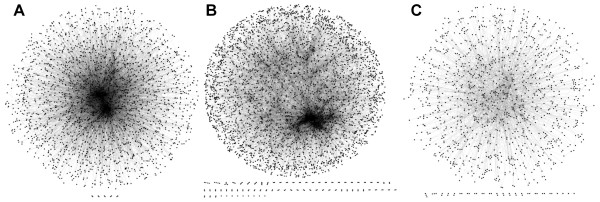
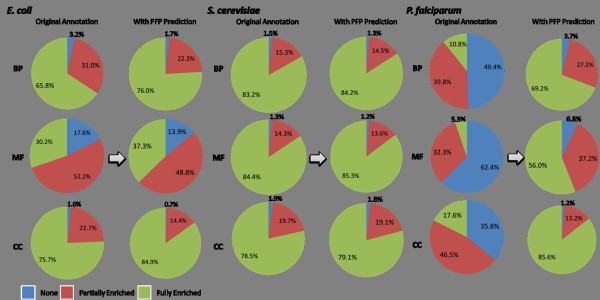
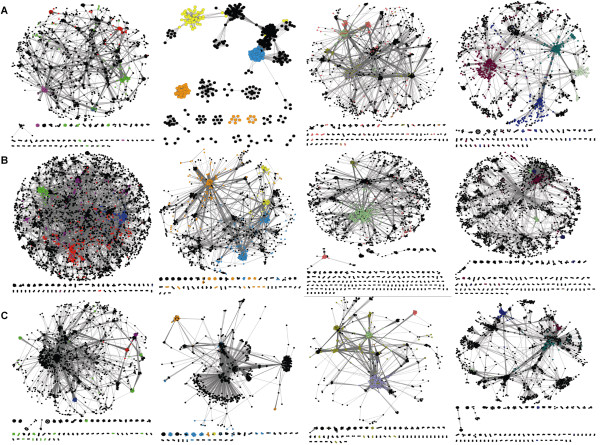
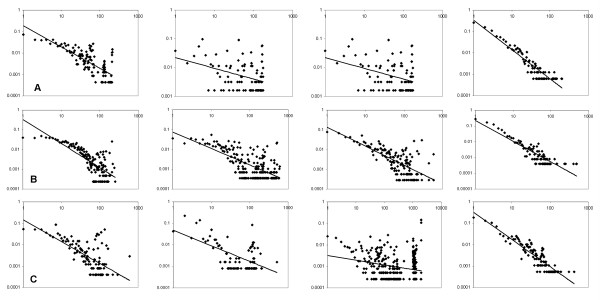
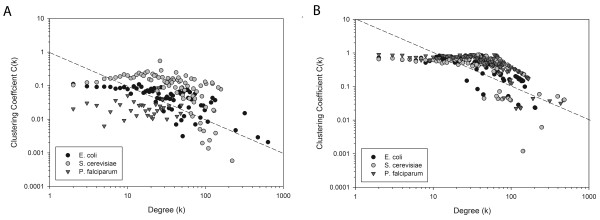
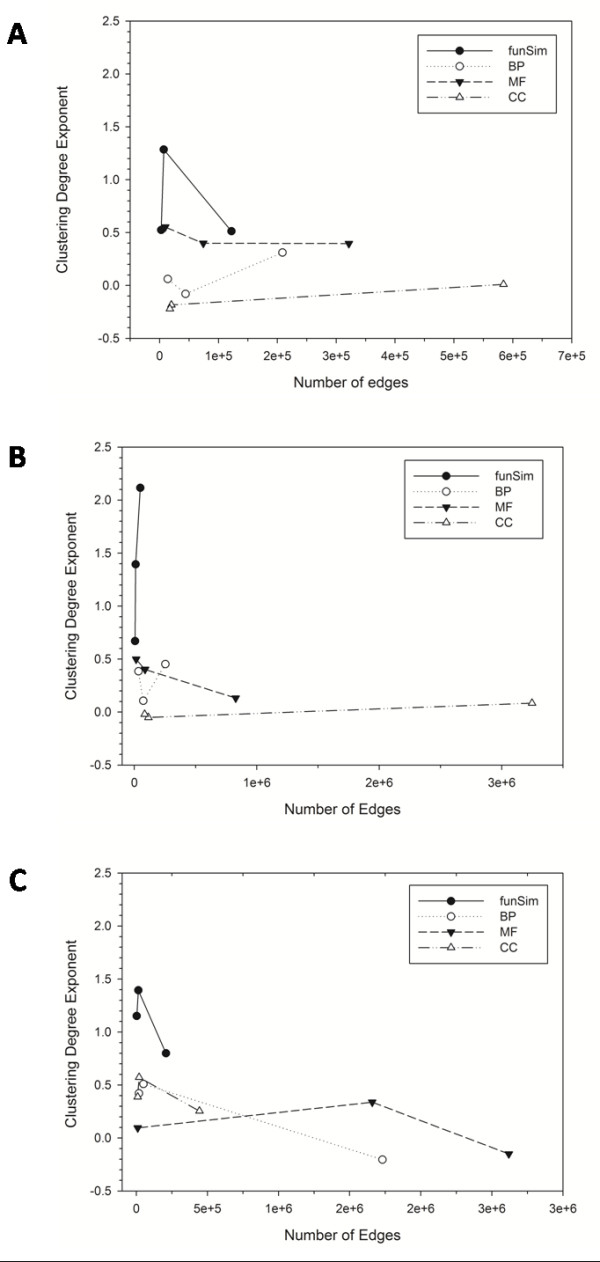
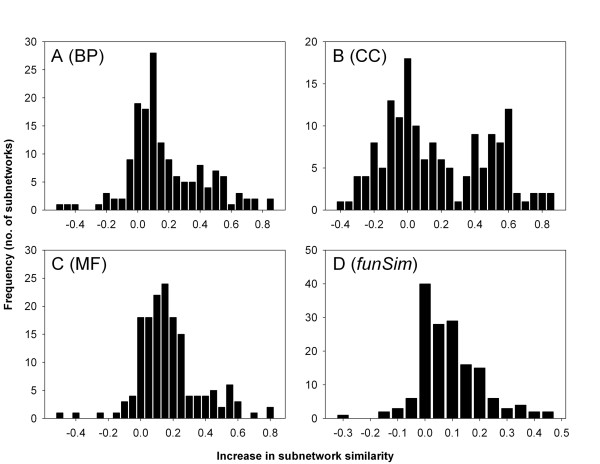
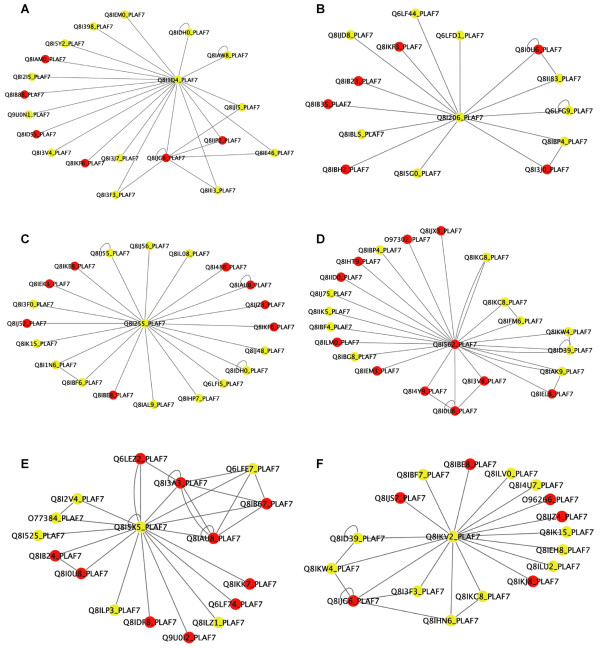
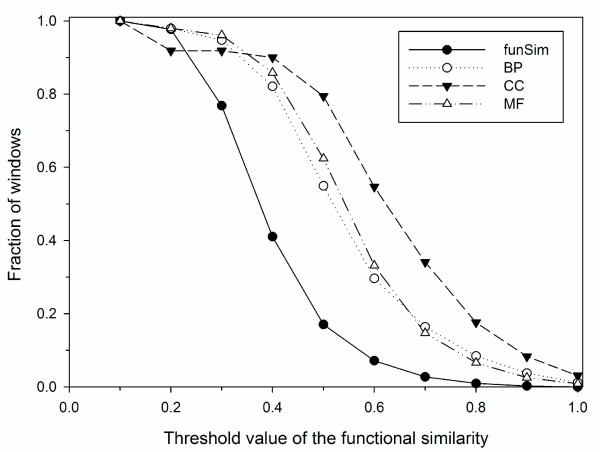
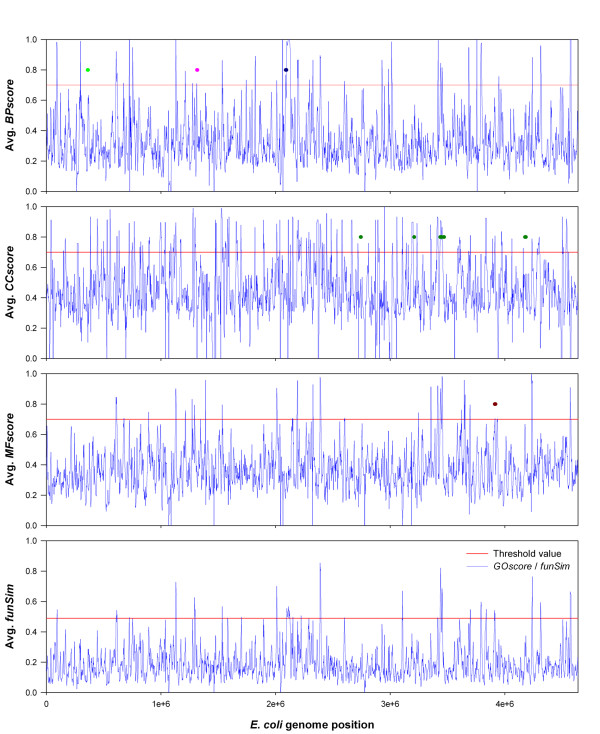
Results: Here we have applied high confidence function predictions from our automated prediction system, PFP, to three genome sequences, Escherichia coli, Saccharomyces cerevisiae, and Plasmodium falciparum (malaria). The number of annotated genes is increased by PFP to over 90% for all of the genomes. Using the large coverage of the function annotation, we introduced the functional similarity networks which represent the functional space of the proteomes. Four different functional similarity networks are constructed for each proteome, one each by considering similarity in a single Gene Ontology (GO) category, i.e. Biological Process, Cellular Component, and Molecular Function, and another one by considering overall similarity with the funSim score. The functional similarity networks are shown to have higher modularity than the protein-protein interaction network. Moreover, the funSim score network is distinct from the single GO-score networks by showing a higher clustering degree exponent value and thus has a higher tendency to be hierarchical. In addition, examining function assignments to the protein-protein interaction network and local regions of genomes has identified numerous cases where subnetworks or local regions have functionally coherent proteins. These results will help interpreting interactions of proteins and gene orders in a genome. Several examples of both analyses are highlighted.
Conclusion: The analyses demonstrate that applying high confidence predictions from PFP can have a significant impact on a researchers' ability to interpret the immense biological data that are being generated today. The newly introduced functional similarity networks of the three organisms show different network properties as compared with the protein-protein interaction networks.
Figures
Similar articles
-
PFP: Automated prediction of gene ontology functional annotations with confidence scores using protein sequence data.Proteins. 2009 Feb 15;74(3):566-82. doi: 10.1002/prot.22172. Proteins. 2009. PMID: 18655063
-
AVID: an integrative framework for discovering functional relationships among proteins.BMC Bioinformatics. 2005 Jun 1;6:136. doi: 10.1186/1471-2105-6-136. BMC Bioinformatics. 2005. PMID: 15929793 Free PMC article.
-
Automatic extraction of gene ontology annotation and its correlation with clusters in protein networks.BMC Bioinformatics. 2007 Jul 10;8:243. doi: 10.1186/1471-2105-8-243. BMC Bioinformatics. 2007. PMID: 17620146 Free PMC article.
-
Protein-interaction networks: from experiments to analysis.Drug Discov Today. 2002 Jun 1;7(11):S48-54. doi: 10.1016/s1359-6446(02)02281-x. Drug Discov Today. 2002. PMID: 12047880 Review.
-
The Cartographers toolbox: building bigger and better human protein interaction networks.Brief Funct Genomic Proteomic. 2009 Jan;8(1):1-11. doi: 10.1093/bfgp/elp003. Epub 2009 Mar 12. Brief Funct Genomic Proteomic. 2009. PMID: 19282470 Review.
Cited by
-
Quantification of protein group coherence and pathway assignment using functional association.BMC Bioinformatics. 2011 Sep 19;12:373. doi: 10.1186/1471-2105-12-373. BMC Bioinformatics. 2011. PMID: 21929787 Free PMC article.
-
Structure- and sequence-based function prediction for non-homologous proteins.J Struct Funct Genomics. 2012 Jun;13(2):111-23. doi: 10.1007/s10969-012-9126-6. Epub 2012 Jan 22. J Struct Funct Genomics. 2012. PMID: 22270458 Free PMC article.
-
Revisiting the variation of clustering coefficient of biological networks suggests new modular structure.BMC Syst Biol. 2012 May 1;6:34. doi: 10.1186/1752-0509-6-34. BMC Syst Biol. 2012. PMID: 22548803 Free PMC article.
-
Computational identification of protein-protein interactions in model plant proteomes.Sci Rep. 2019 Jun 19;9(1):8740. doi: 10.1038/s41598-019-45072-8. Sci Rep. 2019. PMID: 31217453 Free PMC article.
-
A network-based gene-weighting approach for pathway analysis.Cell Res. 2012 Mar;22(3):565-80. doi: 10.1038/cr.2011.149. Epub 2011 Sep 6. Cell Res. 2012. PMID: 21894192 Free PMC article.
References
-
- Arifuzzaman M, Maeda M, Itoh A, Nishikata K, Takita C, Saito R, Ara T, Nakahigashi K, Huang HC, Hirai A, Tsuzuki K, Nakamura S, taf-Ul-Amin M, Oshima T, Baba T, Yamamoto N, Kawamura T, Ioka-Nakamichi T, Kitagawa M, Tomita M, Kanaya S, Wada C, Mori H. Large-scale identification of protein-protein interaction of Escherichia coli K-12. Genome Res. 2006;16:686–691. doi: 10.1101/gr.4527806. - DOI - PMC - PubMed
Publication types
MeSH terms
Substances
Grants and funding
LinkOut - more resources
Full Text Sources
Molecular Biology Databases
