

A simple optimization can improve the performance of single feature polymorphism detection by Affymetrix expression arrays
- PMID: 20482895
- PMCID: PMC2885369
- DOI: 10.1186/1471-2164-11-315
A simple optimization can improve the performance of single feature polymorphism detection by Affymetrix expression arrays
Abstract
Background: High-density oligonucleotide arrays are effective tools for genotyping numerous loci simultaneously. In small genome species (genome size: < approximately 300 Mb), whole-genome DNA hybridization to expression arrays has been used for various applications. In large genome species, transcript hybridization to expression arrays has been used for genotyping. Although rice is a fully sequenced model plant of medium genome size (approximately 400 Mb), there are a few examples of the use of rice oligonucleotide array as a genotyping tool.
Results: We compared the single feature polymorphism (SFP) detection performance of whole-genome and transcript hybridizations using the Affymetrix GeneChip Rice Genome Array, using the rice cultivars with full genome sequence, japonica cultivar Nipponbare and indica cultivar 93-11. Both genomes were surveyed for all probe target sequences. Only completely matched 25-mer single copy probes of the Nipponbare genome were extracted, and SFPs between them and 93-11 sequences were predicted. We investigated optimum conditions for SFP detection in both whole genome and transcript hybridization using differences between perfect match and mismatch probe intensities of non-polymorphic targets, assuming that these differences are representative of those between mismatch and perfect targets. Several statistical methods of SFP detection by whole-genome hybridization were compared under the optimized conditions. Causes of false positives and negatives in SFP detection in both types of hybridization were investigated.
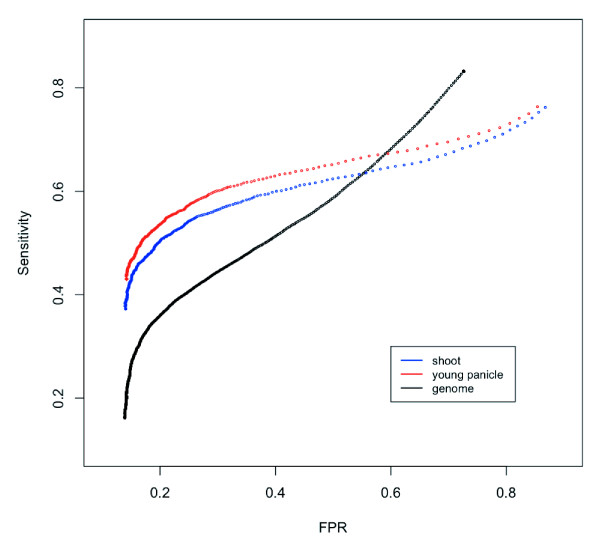
Conclusions: The optimizations allowed a more than 20% increase in true SFP detection in whole-genome hybridization and a large improvement of SFP detection performance in transcript hybridization. Significance analysis of the microarray for log-transformed raw intensities of PM probes gave the best performance in whole genome hybridization, and 22,936 true SFPs were detected with 23.58% false positives by whole genome hybridization. For transcript hybridization, stable SFP detection was achieved for highly expressed genes, and about 3,500 SFPs were detected at a high sensitivity (> 50%) in both shoot and young panicle transcripts. High SFP detection performances of both genome and transcript hybridizations indicated that microarrays of a complex genome (e.g., of Oryza sativa) can be effectively utilized for whole genome genotyping to conduct mutant mapping and analysis of quantitative traits such as gene expression levels.
Figures


Similar articles
-
Discovery and mapping of single feature polymorphisms in wheat using Affymetrix arrays.BMC Genomics. 2009 May 29;10:251. doi: 10.1186/1471-2164-10-251. BMC Genomics. 2009. PMID: 19480702 Free PMC article.
-
A high-density transcript linkage map with 1,845 expressed genes positioned by microarray-based Single Feature Polymorphisms (SFP) in Eucalyptus.BMC Genomics. 2011 Apr 14;12:189. doi: 10.1186/1471-2164-12-189. BMC Genomics. 2011. PMID: 21492453 Free PMC article.
-
Detection and validation of single feature polymorphisms using RNA expression data from a rice genome array.BMC Plant Biol. 2009 May 29;9:65. doi: 10.1186/1471-2229-9-65. BMC Plant Biol. 2009. PMID: 19480680 Free PMC article.
-
Applications of DNA tiling arrays for whole-genome analysis.Genomics. 2005 Jan;85(1):1-15. doi: 10.1016/j.ygeno.2004.10.005. Genomics. 2005. PMID: 15607417 Review.
-
Genomic profiling: cDNA arrays and oligoarrays.Methods Mol Biol. 2012;823:89-105. doi: 10.1007/978-1-60327-216-2_7. Methods Mol Biol. 2012. PMID: 22081341 Review.
Cited by
-
Global expression differences and tissue specific expression differences in rice evolution result in two contrasting types of differentially expressed genes.BMC Genomics. 2015 Dec 23;16:1099. doi: 10.1186/s12864-015-2319-1. BMC Genomics. 2015. PMID: 26699716 Free PMC article.
References
Publication types
MeSH terms
Substances
LinkOut - more resources
Full Text Sources
Molecular Biology Databases
Miscellaneous
