

Relationships between structural dynamics and functional kinetics in oligomeric membrane receptors
- PMID: 20483311
- PMCID: PMC2872211
- DOI: 10.1016/j.bpj.2010.01.050
Relationships between structural dynamics and functional kinetics in oligomeric membrane receptors
Abstract
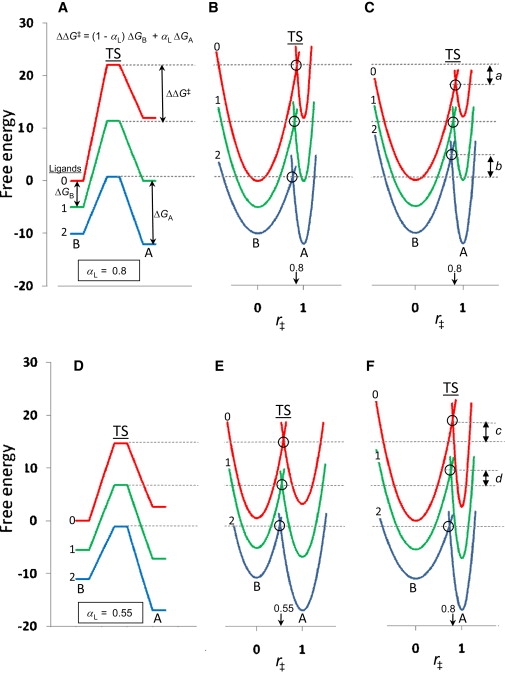
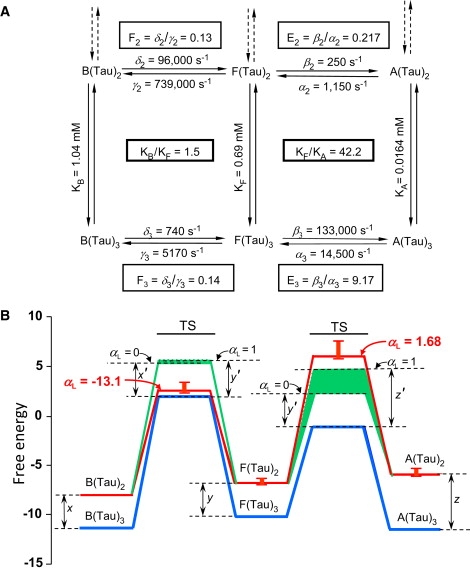
Recent efforts to broaden understanding of the molecular mechanisms of membrane receptors in signal transduction make use of rate-equilibrium free-energy relationships (REFERs), previously applied to chemical reactions, enzyme kinetics, and protein folding. For oligomeric membrane receptors, we distinguish between a), the Leffler parameter alpha(L), to characterize the global transition state for the interconversion between conformations; and b), the Fersht parameter, varphi(F), to assign the degree of progression of individual residue positions at the transition state. For both alpha(L) and varphi(F), insights are achieved by using harmonic energy profiles to reflect the dynamic nature of proteins, as illustrated with single-channel results reported for normal and mutant nicotinic receptors. We also describe new applications of alpha(L) based on published results. For large-conductance calcium-activated potassium channels, data are satisfactorily fit with an alpha(L) value of 0.65, in accord with REFERs. In contrast, results reported for the flip conformational state of glycine and nicotinic receptors are in disaccord with REFERs, since they yield alpha(L) values outside the usual limits of 0-1. Concerning published varphi(F) values underlying the conformational wave hypothesis for nicotinic receptors, we note that interpretations may be complicated by variations in the width of harmonic energy profiles.
Copyright 2010 Biophysical Society. Published by Elsevier Inc. All rights reserved.
Figures
Similar articles
-
Coupling between voltage sensor activation, Ca2+ binding and channel opening in large conductance (BK) potassium channels.J Gen Physiol. 2002 Sep;120(3):267-305. doi: 10.1085/jgp.20028605. J Gen Physiol. 2002. PMID: 12198087 Free PMC article.
-
A kinetic mechanism for nicotinic acetylcholine receptors based on multiple allosteric transitions.Biol Cybern. 1996 Nov;75(5):361-79. doi: 10.1007/s004220050302. Biol Cybern. 1996. PMID: 8983160
-
Allosteric interactions and the modular nature of the voltage- and Ca2+-activated (BK) channel.J Physiol. 2010 Sep 1;588(Pt 17):3141-8. doi: 10.1113/jphysiol.2010.191999. Epub 2010 Jul 5. J Physiol. 2010. PMID: 20603335 Free PMC article. Review.
-
Differential effects of beta 1 and beta 2 subunits on BK channel activity.J Gen Physiol. 2005 Apr;125(4):395-411. doi: 10.1085/jgp.200409236. Epub 2005 Mar 14. J Gen Physiol. 2005. PMID: 15767297 Free PMC article.
-
Molecular dynamics of nicotinic acetylcholine receptor correlating biological functions.Curr Protein Pept Sci. 2006 Jun;7(3):195-200. doi: 10.2174/138920306777452321. Curr Protein Pept Sci. 2006. PMID: 16787259 Review.
Cited by
-
Conformational selection or induced fit? 50 years of debate resolved.F1000 Biol Rep. 2011;3:19. doi: 10.3410/B3-19. Epub 2011 Sep 1. F1000 Biol Rep. 2011. PMID: 21941598 Free PMC article.
-
Perspectives on: conformational coupling in ion channels: allosteric coupling in ligand-gated ion channels.J Gen Physiol. 2012 Dec;140(6):599-612. doi: 10.1085/jgp.201210844. J Gen Physiol. 2012. PMID: 23183696 Free PMC article. No abstract available.
-
Medicinal chemistry for 2020.Future Med Chem. 2011 Oct;3(14):1765-86. doi: 10.4155/fmc.11.135. Future Med Chem. 2011. PMID: 22004084 Free PMC article.
-
The Monod-Wyman-Changeux allosteric model accounts for the quaternary transition dynamics in wild type and a recombinant mutant human hemoglobin.Proc Natl Acad Sci U S A. 2012 Sep 11;109(37):14894-9. doi: 10.1073/pnas.1205809109. Epub 2012 Aug 27. Proc Natl Acad Sci U S A. 2012. PMID: 22927385 Free PMC article.
-
From the stochasticity of molecular processes to the variability of synaptic transmission.Nat Rev Neurosci. 2011 Jun 20;12(7):375-87. doi: 10.1038/nrn3025. Nat Rev Neurosci. 2011. PMID: 21685931 Review.
References
-
- Brønsted J.N. Acid and basic catalysis. Chem. Rev. 1928;5:231–338.
-
- Leffler J.E. Parameters for the description of transition states. Science. 1953;117:340–341. - PubMed
-
- Hammond G.S. A correlation of reaction rates. J. Am. Chem. Soc. 1953;77:334–338.
-
- Edelstein S.J., Schaad O., Changeux J.P. A kinetic mechanism for nicotinic acetylcholine receptors based on multiple allosteric transitions. Biol. Cybern. 1996;75:361–379. - PubMed
-
- Fersht A.R., Matouschek A., Serrano L. The folding of an enzyme. I. Theory of protein engineering analysis of stability and pathway of protein folding. J. Mol. Biol. 1992;224:771–782. - PubMed
Publication types
MeSH terms
Substances
Grants and funding
LinkOut - more resources
Full Text Sources
