

Retardation of Abeta fibril formation by phospholipid vesicles depends on membrane phase behavior
- PMID: 20483329
- PMCID: PMC2872260
- DOI: 10.1016/j.bpj.2010.01.063
Retardation of Abeta fibril formation by phospholipid vesicles depends on membrane phase behavior
Abstract
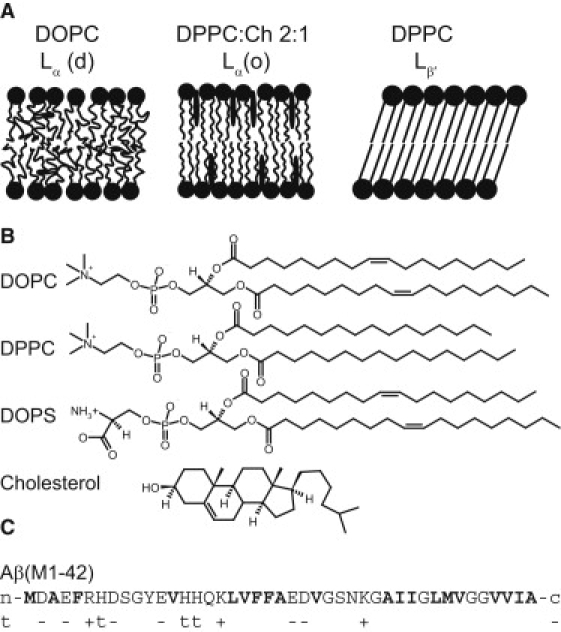
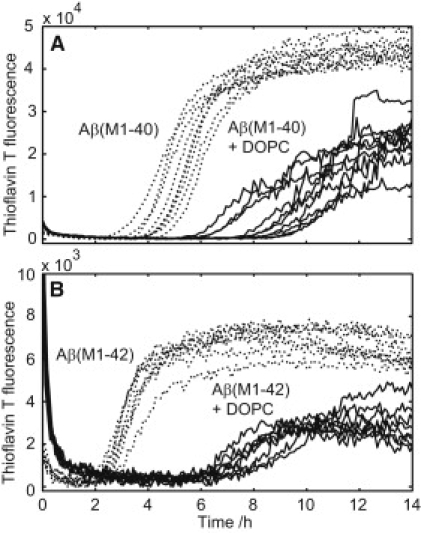
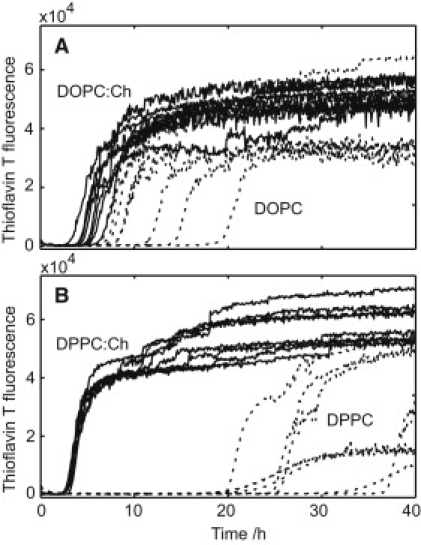
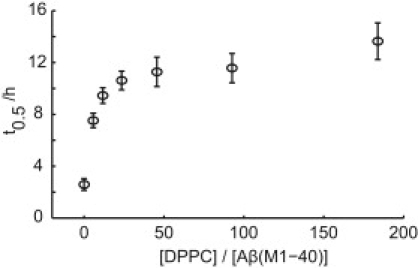
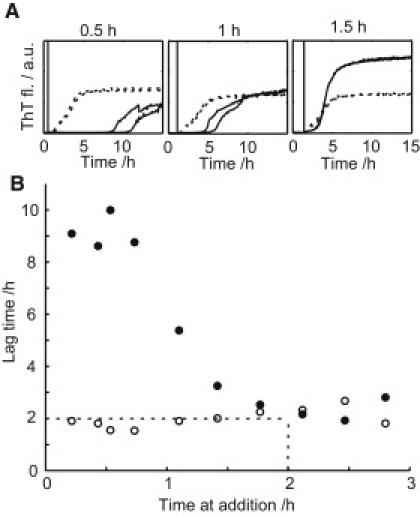
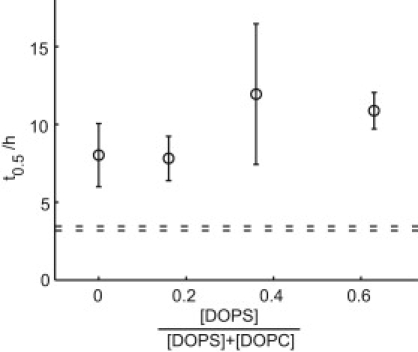
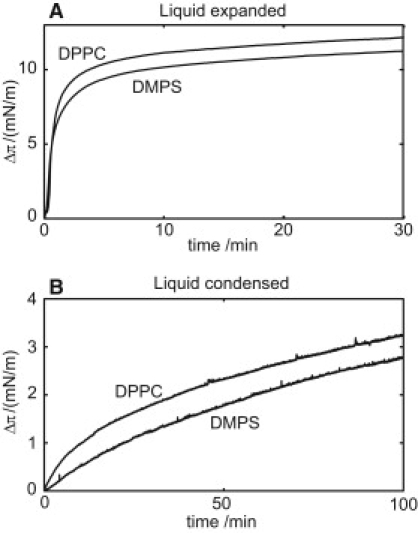
An increasing amount of evidence suggests that in several amyloid diseases, the fibril formation in vivo and the mechanism of toxicity both involve membrane interactions. We have studied Alzheimer's disease related amyloid beta peptide (Abeta). Recombinant Abeta(M1-40) and Abeta(M1-42) produced in Escherichia coli, allows us to carry out large scale kinetics assays with good statistics. The amyloid formation process is followed in means of thioflavin T fluorescence at relatively low (down to 380 nM) peptide concentration approaching the physiological range. The lipid membranes are introduced in the system as large and small unilamellar vesicles. The aggregation lagtime increases in the presence of lipid vesicles for all situations investigated and the phase behavior of the membrane in the vesicles has a large effect on the aggregation kinetics. By comparing vesicles with different membrane phase behavior we see that the solid gel phase dipalmitoylphosphatidylcholine bilayers cause the largest retardation of Abeta fibril formation. The membrane-induced retardation reaches saturation and is present when the vesicles are added during the lag time up to the nucleation point. No significant difference is detected in lag time when increasing amount of negative charge is incorporated into the membrane.
Copyright 2010 Biophysical Society. Published by Elsevier Inc. All rights reserved.
Figures
Similar articles
-
Lipid membranes catalyse the fibril formation of the amyloid-β (1-42) peptide through lipid-fibril interactions that reinforce secondary pathways.Biochim Biophys Acta Biomembr. 2017 Oct;1859(10):1921-1929. doi: 10.1016/j.bbamem.2017.05.012. Epub 2017 May 28. Biochim Biophys Acta Biomembr. 2017. PMID: 28564579
-
Therapeutic potential for amyloid surface inhibitor: only amyloid-β oligomers formed by secondary nucleation disrupt lipid membrane integrity.FEBS J. 2022 Nov;289(21):6767-6781. doi: 10.1111/febs.16550. Epub 2022 Jun 19. FEBS J. 2022. PMID: 35670622
-
Surface behavior and lipid interaction of Alzheimer beta-amyloid peptide 1-42: a membrane-disrupting peptide.Biophys J. 2005 Apr;88(4):2706-13. doi: 10.1529/biophysj.104.055582. Epub 2005 Jan 28. Biophys J. 2005. PMID: 15681641 Free PMC article.
-
Amyloid-β Interactions with Lipid Rafts in Biomimetic Systems: A Review of Laboratory Methods.Methods Mol Biol. 2021;2187:47-86. doi: 10.1007/978-1-0716-0814-2_4. Methods Mol Biol. 2021. PMID: 32770501 Review.
-
The interplay between lipid and Aβ amyloid homeostasis in Alzheimer's Disease: risk factors and therapeutic opportunities.Chem Phys Lipids. 2021 May;236:105072. doi: 10.1016/j.chemphyslip.2021.105072. Epub 2021 Mar 4. Chem Phys Lipids. 2021. PMID: 33675779 Review.
Cited by
-
Tuning the surface charge of phospholipid bilayers inhibits insulin fibrilization.Colloids Surf B Biointerfaces. 2022 Dec;220:112904. doi: 10.1016/j.colsurfb.2022.112904. Epub 2022 Oct 13. Colloids Surf B Biointerfaces. 2022. PMID: 36265317 Free PMC article.
-
Biochemistry of amyloid β-protein and amyloid deposits in Alzheimer disease.Cold Spring Harb Perspect Med. 2012 Jun;2(6):a006262. doi: 10.1101/cshperspect.a006262. Cold Spring Harb Perspect Med. 2012. PMID: 22675658 Free PMC article. Review.
-
The on-fibrillation-pathway membrane content leakage and off-fibrillation-pathway lipid mixing induced by 40-residue β-amyloid peptides in biologically relevant model liposomes.Biochim Biophys Acta Biomembr. 2018 Sep;1860(9):1670-1680. doi: 10.1016/j.bbamem.2018.03.008. Epub 2018 Mar 13. Biochim Biophys Acta Biomembr. 2018. PMID: 29548698 Free PMC article.
-
Charge dependent retardation of amyloid β aggregation by hydrophilic proteins.ACS Chem Neurosci. 2014 Apr 16;5(4):266-74. doi: 10.1021/cn400124r. Epub 2014 Feb 6. ACS Chem Neurosci. 2014. PMID: 24475785 Free PMC article.
-
Fibrillization of 40-Residue β-Amyloid Peptides in Membrane-Like Environments Leads to Different Fibril Structures and Reduced Molecular Polymorphisms.Biomolecules. 2020 Jun 8;10(6):881. doi: 10.3390/biom10060881. Biomolecules. 2020. PMID: 32521743 Free PMC article.
References
-
- Walsh D.M., Klyubin I., Selkoe D.J. Naturally secreted oligomers of amyloid beta protein potently inhibit hippocampal long-term potentiation in vivo. Nature. 2002;416:535–539. - PubMed
-
- Gorbenko G.P., Kinnunen P.K.J. The role of lipid-protein interactions in amyloid-type protein fibril formation. Chem. Phys. Lipids. 2005;141:72–82. - PubMed
-
- Kremer J.J., Pallitto M.M., Murphy R.M. Correlation of beta-amyloid aggregate size and hydrophobicity with decreased bilayer fluidity of model membranes. Biochemistry. 2000;39:10309–10318. - PubMed
Publication types
MeSH terms
Substances
LinkOut - more resources
Full Text Sources
Medical
