

Dual mechanisms of allosteric acceleration of the Na(+),K(+)-ATPase by ATP
- PMID: 20483338
- PMCID: PMC2872473
- DOI: 10.1016/j.bpj.2010.01.038
Dual mechanisms of allosteric acceleration of the Na(+),K(+)-ATPase by ATP
Abstract
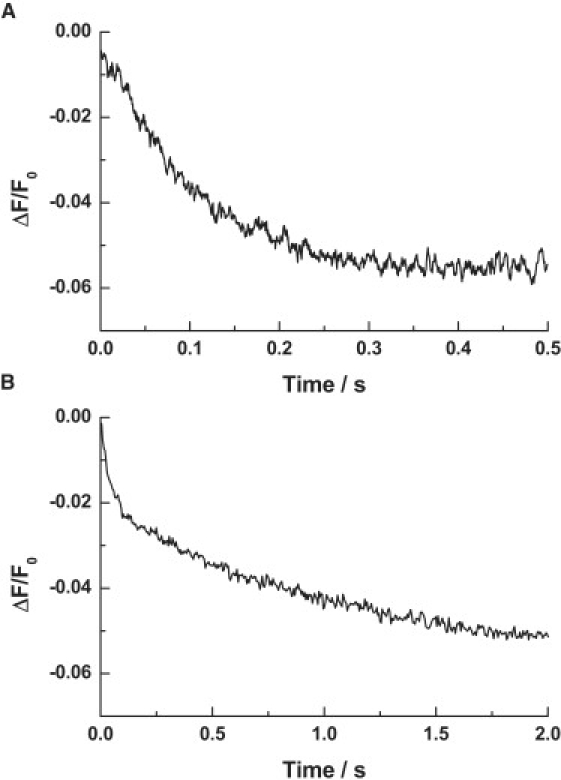
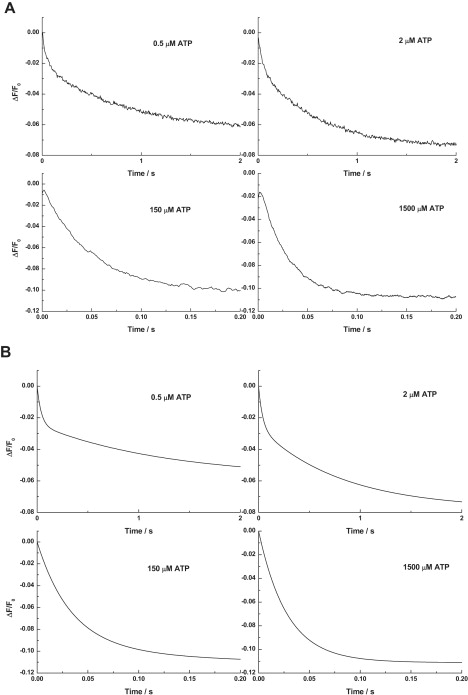
Investigations of the E2 --> E1 conformational change of Na(+),K(+)-ATPase from shark rectal gland and pig kidney via the stopped-flow technique have revealed major differences in the kinetics and mechanisms of the two enzymes. Mammalian kidney Na(+),K(+)-ATPase appears to exist in a diprotomeric (alphabeta)(2) state in the absence of ATP, with protein-protein interactions between the alpha-subunits causing an inhibition of the transition, which occurs as a two-step process: E2:E2 --> E2:E1 --> E1:E1. This is evidenced by a biphasicity in the observed kinetics. Binding of ATP to the E1 or E2 states causes the kinetics to become monophasic and accelerate, which can be explained by an ATP-induced dissociation of the diprotomer into separate alphabeta protomers and relief of the preexisting inhibition. In the case of enzyme from shark rectal gland, the observed kinetics are monophasic at all ATP concentrations, indicating a monoprotomeric enzyme; however, an acceleration of the E2 --> E1 transition by ATP still occurs, to a maximum rate constant of 182 (+/- 6) s(-1). This indicates that ATP has two separate mechanisms whereby it accelerates the E2 --> E1 transition of Na(+),K(+)-ATPase alphabeta protomers and (alphabeta)(2) diprotomers.
Copyright 2010 Biophysical Society. Published by Elsevier Inc. All rights reserved.
Figures


Similar articles
-
Pumping ions.Clin Exp Pharmacol Physiol. 2011 Nov;38(11):726-33. doi: 10.1111/j.1440-1681.2011.05590.x. Clin Exp Pharmacol Physiol. 2011. PMID: 21848638 Review.
-
Allosteric effect of ATP on Na(+),K(+)-ATPase conformational kinetics.Biochemistry. 2007 Jun 12;46(23):7034-44. doi: 10.1021/bi700619s. Epub 2007 May 19. Biochemistry. 2007. PMID: 17511477
-
Effects of ATP and monovalent cations on Mg2+ inhibition of (Na,K)-ATPase.Arch Biochem Biophys. 1986 Feb 1;244(2):596-606. doi: 10.1016/0003-9861(86)90628-4. Arch Biochem Biophys. 1986. PMID: 3004346
-
Interaction of ATP with the phosphoenzyme of the Na+,K+-ATPase.Biochemistry. 2010 Feb 16;49(6):1248-58. doi: 10.1021/bi9019548. Biochemistry. 2010. PMID: 20063899
-
The mechanism of the modifying effect of ATP on Na(+)-K+ ATPase.Biomed Sci. 1991;2(5):450-4. Biomed Sci. 1991. PMID: 1668643 Review.
Cited by
-
Consensus, controversies, and conundrums of P4-ATPases: The emerging face of eukaryotic lipid flippases.J Biol Chem. 2024 Jun;300(6):107387. doi: 10.1016/j.jbc.2024.107387. Epub 2024 May 17. J Biol Chem. 2024. PMID: 38763336 Free PMC article. Review.
-
Angiotensin II-dependent phosphorylation at Ser11/Ser18 and Ser938 shifts the E2 conformations of rat kidney Na+/K+-ATPase.Biochem J. 2012 Apr 1;443(1):249-58. doi: 10.1042/BJ20111398. Biochem J. 2012. PMID: 22145807 Free PMC article.
-
Cholesterol depletion inhibits Na+,K+-ATPase activity in a near-native membrane environment.J Biol Chem. 2019 Apr 12;294(15):5956-5969. doi: 10.1074/jbc.RA118.006223. Epub 2019 Feb 15. J Biol Chem. 2019. PMID: 30770471 Free PMC article.
-
Comparative properties of caveolar and noncaveolar preparations of kidney Na+/K+-ATPase.Biochemistry. 2011 Oct 11;50(40):8664-73. doi: 10.1021/bi2009008. Epub 2011 Sep 16. Biochemistry. 2011. PMID: 21905705 Free PMC article.
-
Kinetics of K(+) occlusion by the phosphoenzyme of the Na(+),K(+)-ATPase.Biophys J. 2011 Jan 5;100(1):70-9. doi: 10.1016/j.bpj.2010.11.038. Biophys J. 2011. PMID: 21190658 Free PMC article.
References
-
- Clarke R.J. Mechanism of allosteric effects of ATP on the kinetics of P-type ATPases. Eur. Biophys. J. 2009;39:3–17. - PubMed
-
- Scheiner-Bobis G. The sodium pump. Its molecular properties and mechanics of ion transport. Eur. J. Biochem. 2002;168:123–131. - PubMed
-
- Steinberg M., Karlish S.J.D. Studies on conformational changes in Na,K-ATPase labeled with 5-iodoacetamidofluorescein. J. Biol. Chem. 1989;264:2726–2734. - PubMed
-
- Humphrey P.A., Lüpfert C., Clarke R.J. Mechanism of the rate-determining step of the Na+,K+-ATPase pump cycle. Biochemistry. 2002;41:9496–9507. - PubMed
Publication types
MeSH terms
Substances
LinkOut - more resources
Full Text Sources
Medical
