Comparative Study
. 2010 Aug 26;43(12):2400-9.
doi: 10.1016/j.jbiomech.2010.04.020. Epub 2010 May 21.

Device Thrombogenicity Emulator (DTE)--design optimization methodology for cardiovascular devices: a study in two bileaflet MHV designs

Affiliations
Comparative Study

Device Thrombogenicity Emulator (DTE)--design optimization methodology for cardiovascular devices: a study in two bileaflet MHV designs

Michalis Xenos et al. J Biomech. .

Abstract

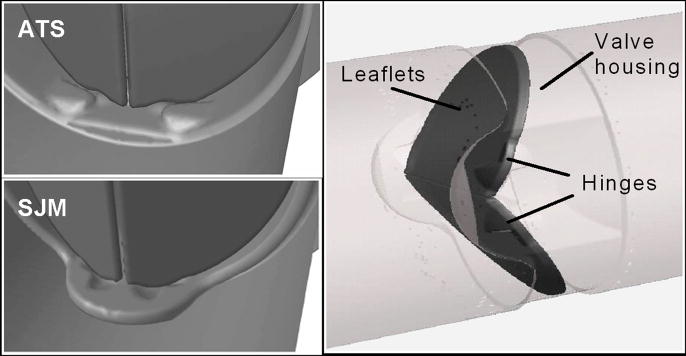
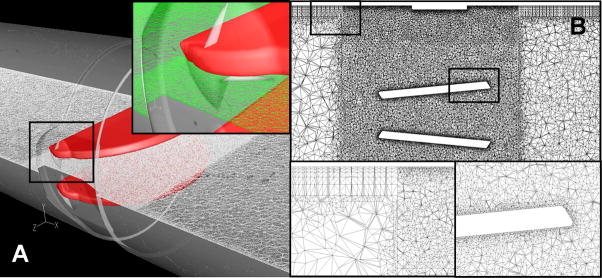
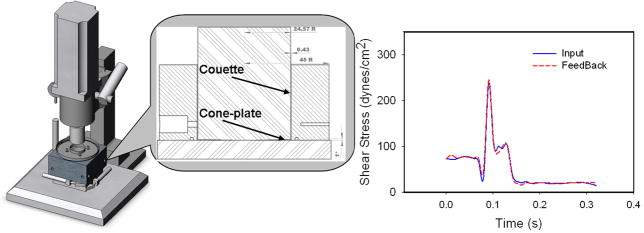
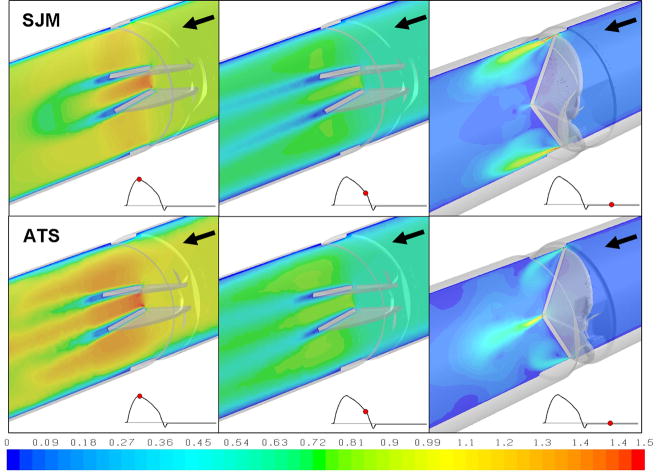
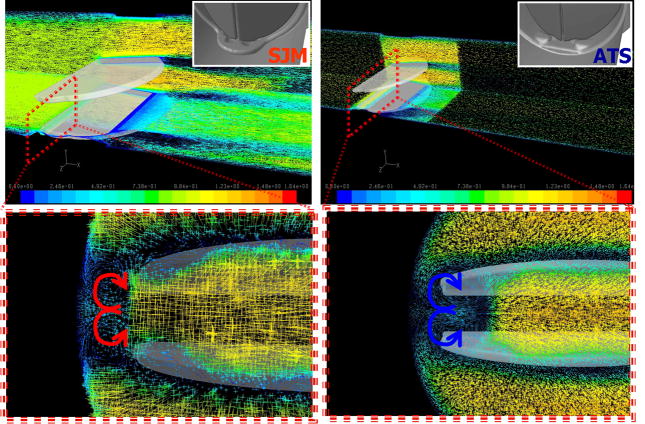
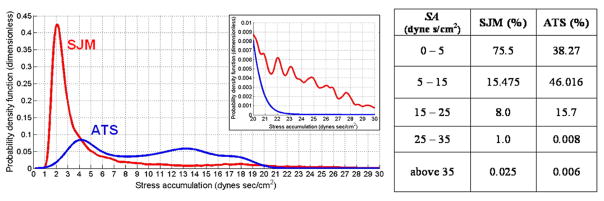
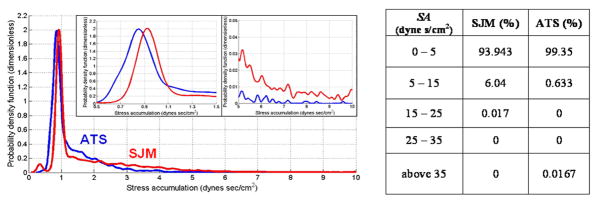
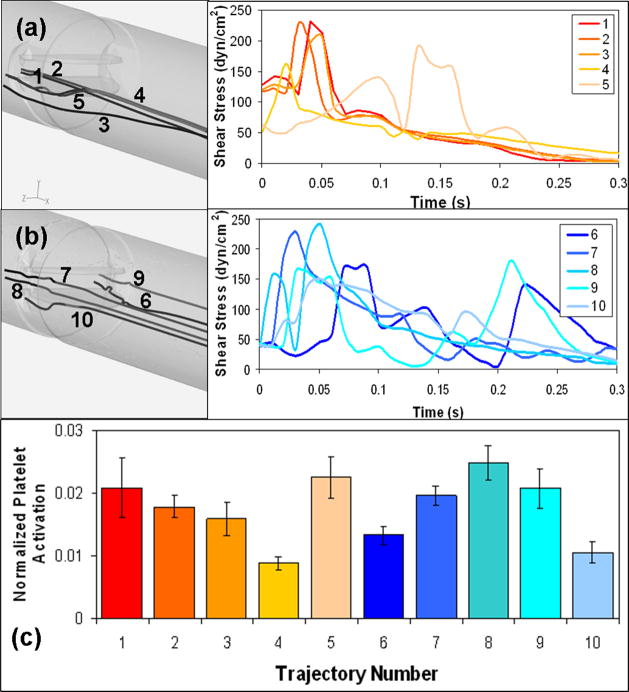
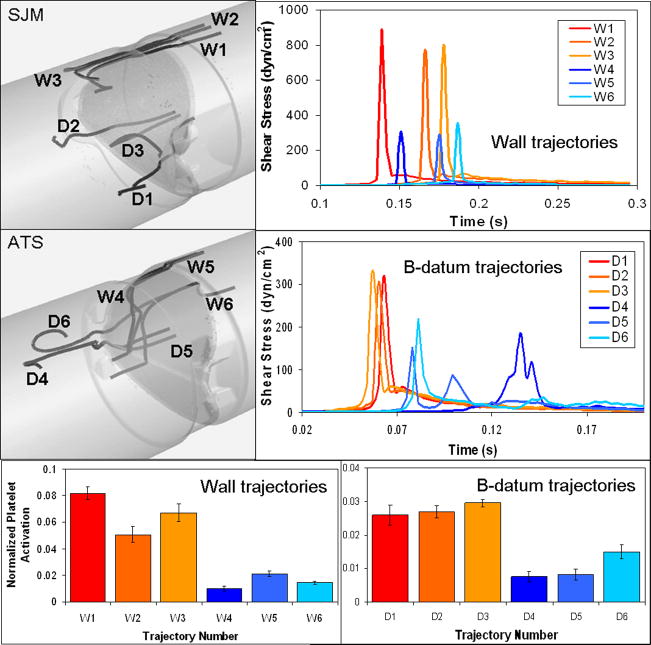
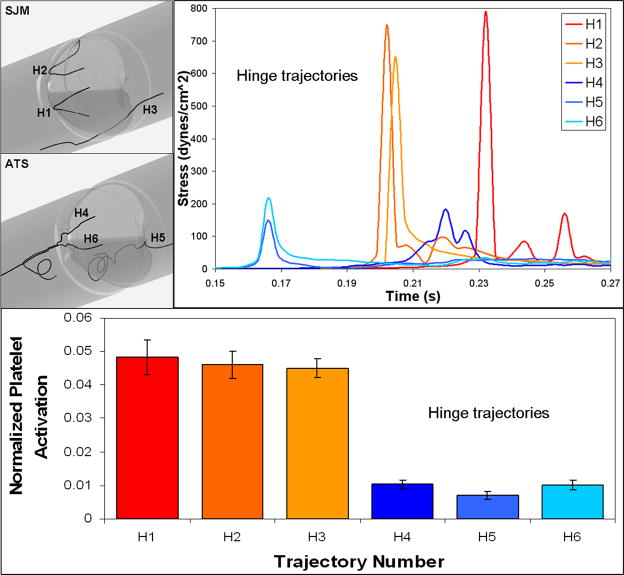
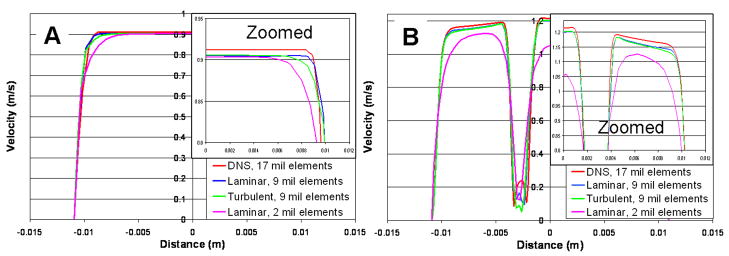
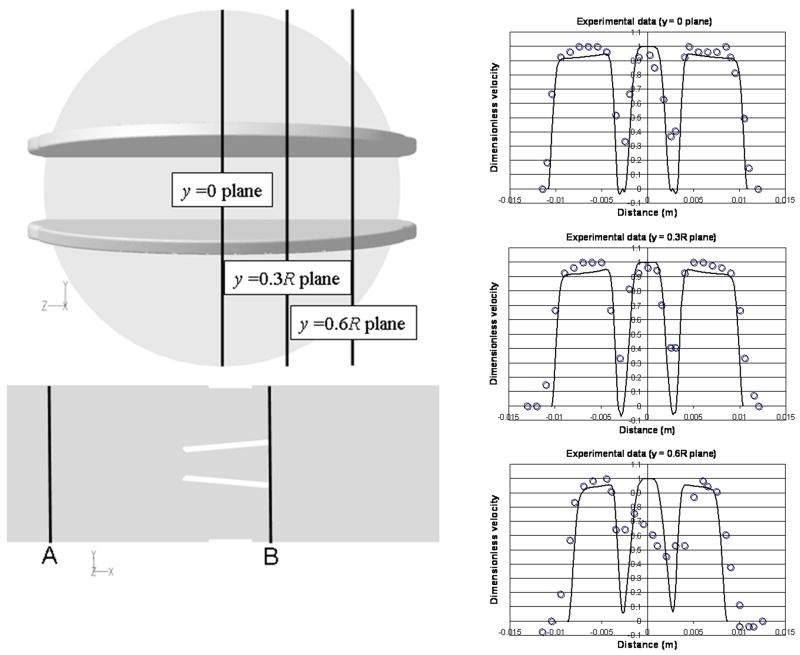
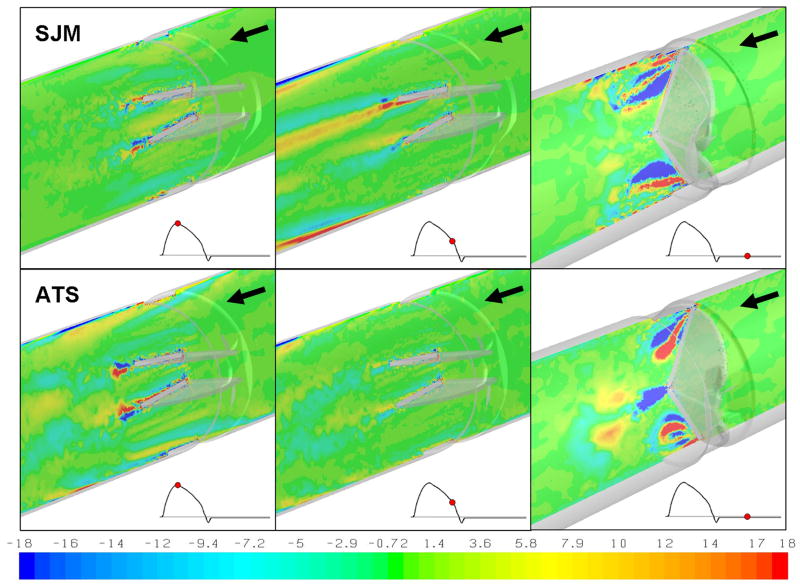
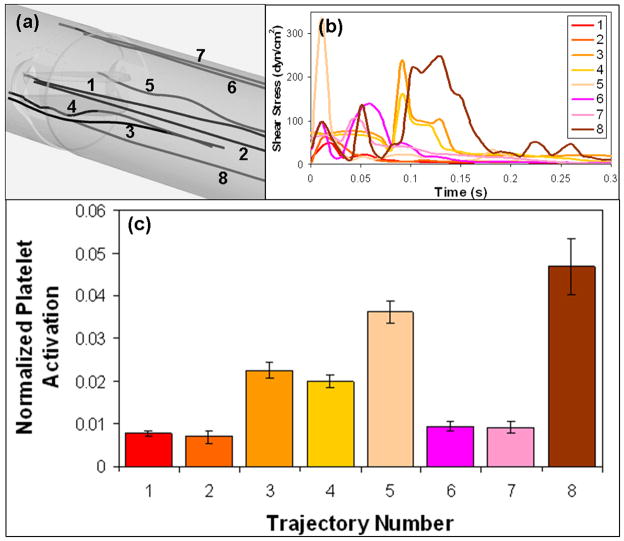
Patients who receive prosthetic heart valve (PHV) implants require mandatory anticoagulation medication after implantation due to the thrombogenic potential of the valve. Optimization of PHV designs may facilitate reduction of flow-induced thrombogenicity and reduce or eliminate the need for post-implant anticoagulants. We present a methodology entitled Device Thrombogenicty Emulator (DTE) for optimizing the thrombo-resistance performance of PHV by combining numerical and experimental approaches. Two bileaflet mechanical heart valves (MHV) designs, St. Jude Medical (SJM) and ATS, were investigated by studying the effect of distinct flow phases on platelet activation. Transient turbulent and direct numerical simulations (DNS) were conducted, and stress loading histories experienced by the platelets were calculated along flow trajectories. The numerical simulations indicated distinct design dependent differences between the two valves. The stress loading waveforms extracted from the numerical simulations were programmed into a hemodynamic shearing device (HSD), emulating the flow conditions past the valves in distinct 'hot-spot' flow regions that are implicated in MHV thrombogenicity. The resultant platelet activity was measured with a modified prothrombinase assay, and was found to be significantly higher in the SJM valve, mostly during the regurgitation phase. The experimental results were in excellent agreement with the calculated platelet activation potential. This establishes the utility of the DTE methodology for serving as a test bed for evaluating design modifications for achieving better thrombogenic performance for such devices.


Figures

Figure 1
Figure 1
Geometric details of the hinges regions of a 22 mm AP ATS open pivot valve and a 22 mm SJM Regent valve (both in closed position) – left. Geometric details of the bileaflet SJM MHV – right.
Figure 2
Figure 2
(A) A horizontal cross-sectional plane showing the computational mesh near the open leaflets of the MHV. Inset shows the details of the computational grid near the hinges. (B) A vertical cross-sectional plane showing the computational mesh at the leaflets. The insets depict the boundary layers mesh near the wall (left) and the grid at the vicinity of the leaflet (right).
Figure 3
Figure 3
Schematic of the Hemodynamic Shearing Device (HSD) and an example of accurate emulation of an highly dynamic platelet shear stress loading waveform that was extracted from a numerical simulation platelet trajectory in MHV.
Figure 4
Figure 4
Velocity flow field at the center plane for SJM and ATS MHV during the cardiac cycle. Three time instants are shown: peak systole, deceleration phase, and regurgitant flow through the closed valve during diastole. Arrows indicate the blood flow direction (valve geometry is reversed during the regurgitant flow phase to reveal the flow field behind the closed leaflets).
Figure 5
Figure 5
A pair of counter-rotating vortices emanating from the jet flow that is generated in the hinges region of the SJM and ATS MHVs (transverse cross-section, details appear in the cross-sectional zoom-in–bottom). In an animation of the simulation (Animation 1) for the ATS valve the spinning of these counter rotating vortices is faster and entrained towards the core flow, while for the SJM larger counter rotating vortices are spinning slower and closer to the valve housing (the hinges are shown in the insets).
Figure 6
Figure 6
Probability density function (PDF) of the stress accumulation (SA) distribution during the forward flow phase through the open valve for SJM, red line, and ATS, blue line. The distributions reveal the thrombogenic ‘footprint’ of each design. The inset indicates that at higher SA range (SA > 20 dyne×s/cm2) the ATS appears to have an advantage over the SJM. Percentages of the number of platelets reaching a specific SA range appear in the table.
Figure 7
Figure 7
Probability density function (PDF) of the stress accumulation (SA) distribution during regurgitation (SJM- red line, ATS- blue line). The details in the insets reveal the differences in the PDFs modes. At higher SA range the ATS appears to have a significant advantage over the SJM. Percentages of the number of platelets reaching a specific SA range appear in the table.
Figure 8
Figure 8
Platelet experiments in the HSD emulating hinge region trajectories through the valves during forward flow: (a) SJM hinges trajectories (1–5) and the corresponding shear stress loading waveforms (b) ATS hinges trajectories (6–10) and the corresponding shear stress loading waveforms (c) Platelet activation corresponding to 600 repeats of each trajectory, measured with PAS.
Figure 9
Figure 9
Platelet experiments in the HSD emulating elevated shear stress trajectories through the valves during regurgitation; grouped into wall trajectories (W1–W3 SJM; W4–W6 ATS) and B-datum trajectories (D1–D3 SJM; D4–D6 ATS) (left) and the corresponding shear stress loading waveforms (right). The corresponding platelet activation in response to 600 repeats of each stress trajectory, measured with PAS appears at the bottom.
Figure 10
Figure 10
Platelet experiments in the HSD emulating hinge region trajectories through the valves during regurgitation (H1–H3 SJM; H4–H6 ATS) and the corresponding shear stress loading waveforms (top). Platelet activation in response to 600 repeats of each stress trajectory, measured with PAS (bottom).
Figure 11
Figure 11
Grid independence study: velocity profiles comparisons between the different numerical grid resolutions: 2, 9 and 17×106 finite volumes. The velocity profiles are extracted from cross-sections A and B in Figure 12.
Figure 12
Figure 12
Velocity profiles (Re ≈ 6,000) comparisons between the numerical simulations (solid lines), and experimental measurements from literature (open circles – Ge et al., 2005). The measurements are presented for cross-section B (left) at three vertical planes, y = 0, 0.3R and 0.6R planes (R- valve radius).
Figure 13
Figure 13
Vorticity contours (ωx) at the center plane for SJM and ATS MHV during three time instants in the cardiac cycle: peak systole, deceleration phase, and regurgitant flow through the closed valve during diastole. Arrows indicate the blood flow direction (valve geometry is reversed during the regurgitant flow phase to reveal the flow field behind the closed leaflets).
Figure 14
Figure 14
Validation study of the HSD: platelet experiments in the HSD emulating core and non-core trajectories through the SJM-MHV during forward flow: (a) platelet trajectories extracted from the numerical simulations (b) the corresponding loading shear stress waveforms programmed into HSD (c) platelet activation in response to 600 repeats of each stress trajectory, measured with PAS.

Similar articles

Cited by

References

    1. Alemu Y, Bluestein D. Flow-induced platelet activation and damage accumulation in a mechanical heart valve: numerical studies. Artificial Organs. 2007;31(9):677–688. - PubMed
    1. Apel J, Neudel F, Reul H. Computational fluid dynamics and experimental validation of a microaxial blood pump. ASAIO Journal. 2001;47(5):552–558. - PubMed
    1. Arora D, Behr M, Pasquali M. A Tensor-based Measure for Estimating Blood Damage. Artificial Organs. 2004;28(11):1002–1015. - PubMed
    1. Bernet FH, Baykut D, Grize L, Zerkowski HR. Single-center outcome analysis of 1,161 patients with St. Jude medical and ATS open pivot mechanical heart valves. Journal of Heart Valve Disease. 2007;16(2):151–158. - PubMed
    1. Bludszuweit C. Model for a general mechanical blood damage prediction. Artificial Organs. 1995;19(7):583–589. - PubMed

Publication types