. 2010 Jul 2;1217(27):4639-47.
doi: 10.1016/j.chroma.2010.04.065. Epub 2010 May 17.

Development and application of a comprehensive two-dimensional gas chromatography with time-of-flight mass spectrometry method for the analysis of L-beta-methylamino-alanine in human tissue

Affiliations

Development and application of a comprehensive two-dimensional gas chromatography with time-of-flight mass spectrometry method for the analysis of L-beta-methylamino-alanine in human tissue

Laura R Snyder et al. J Chromatogr A. .

Abstract

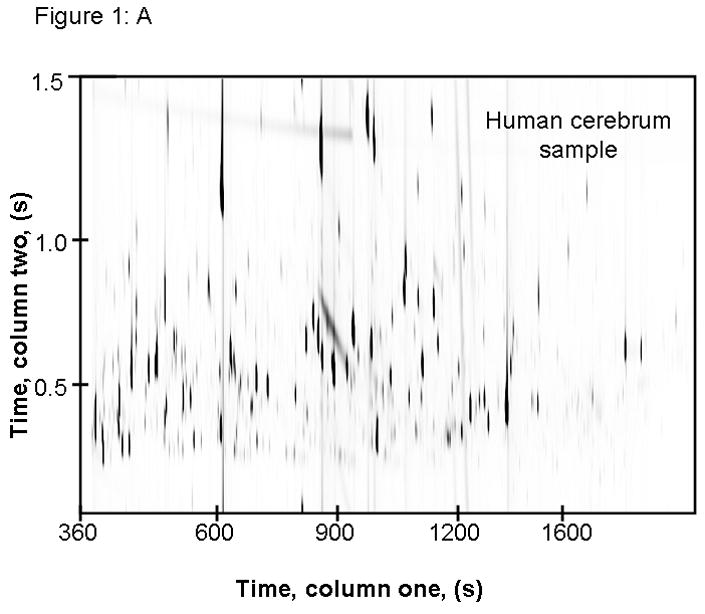
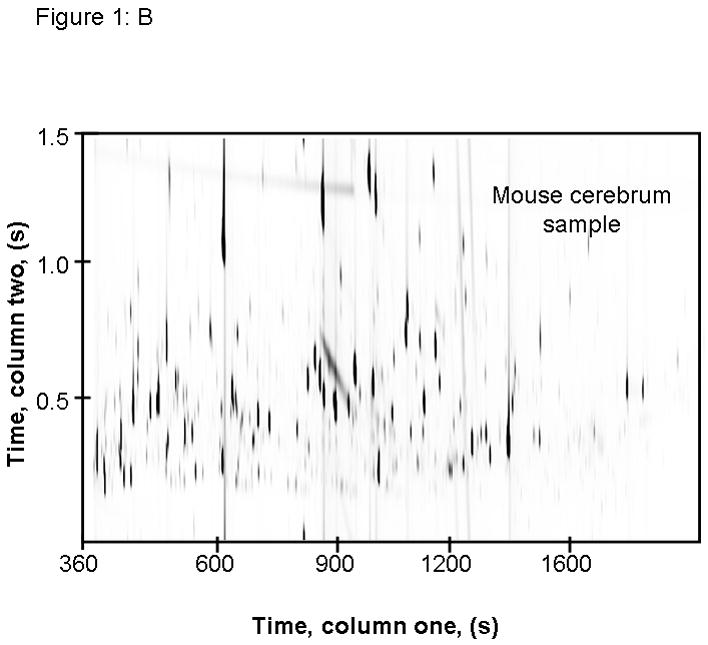
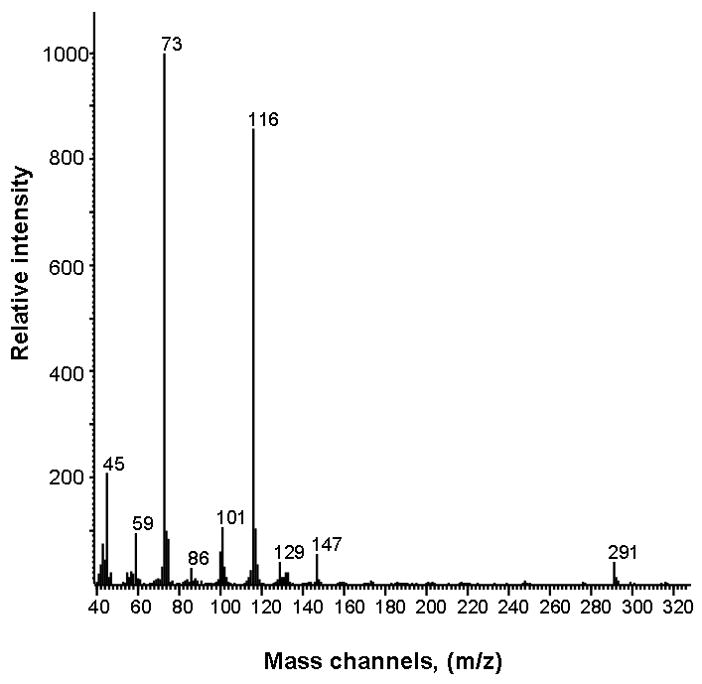
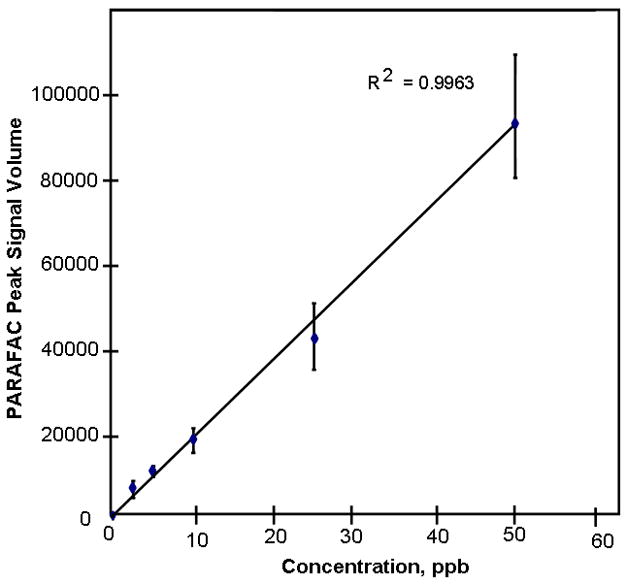
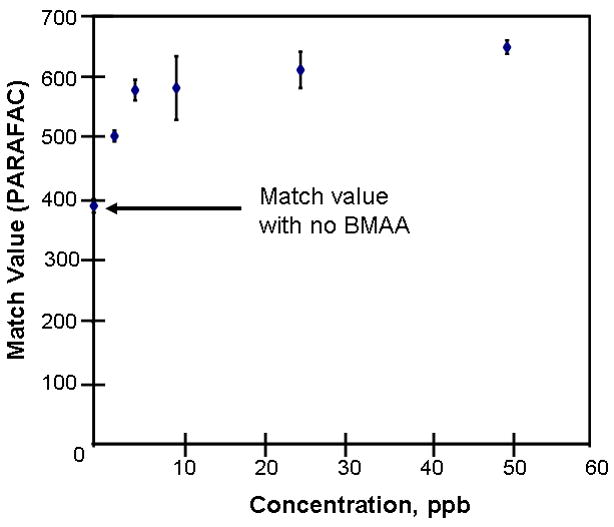
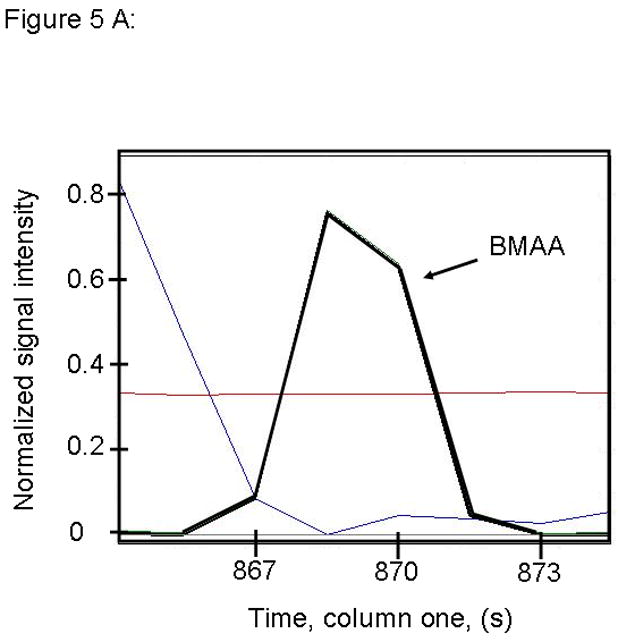
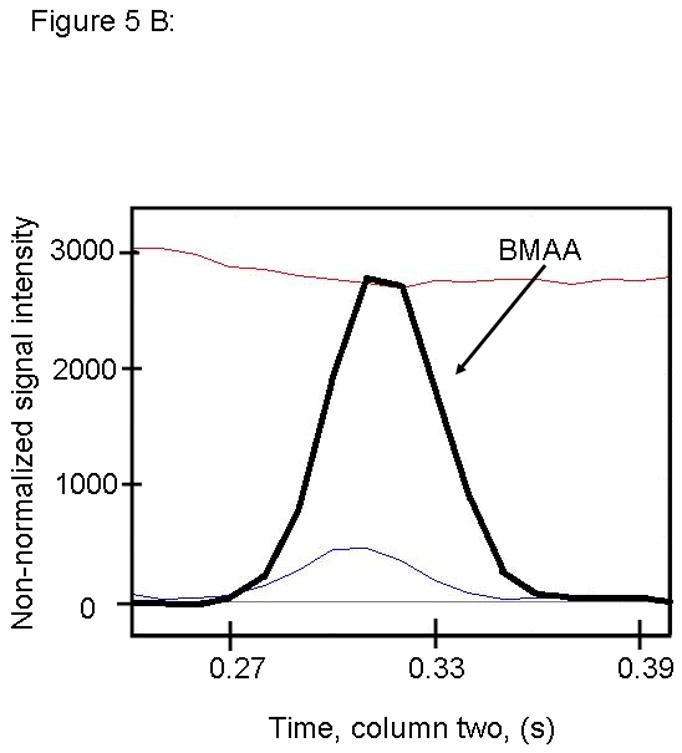
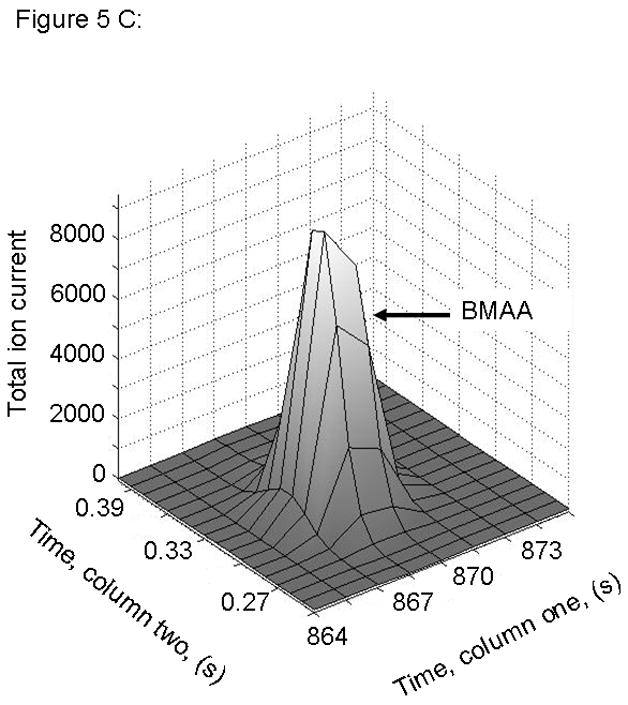
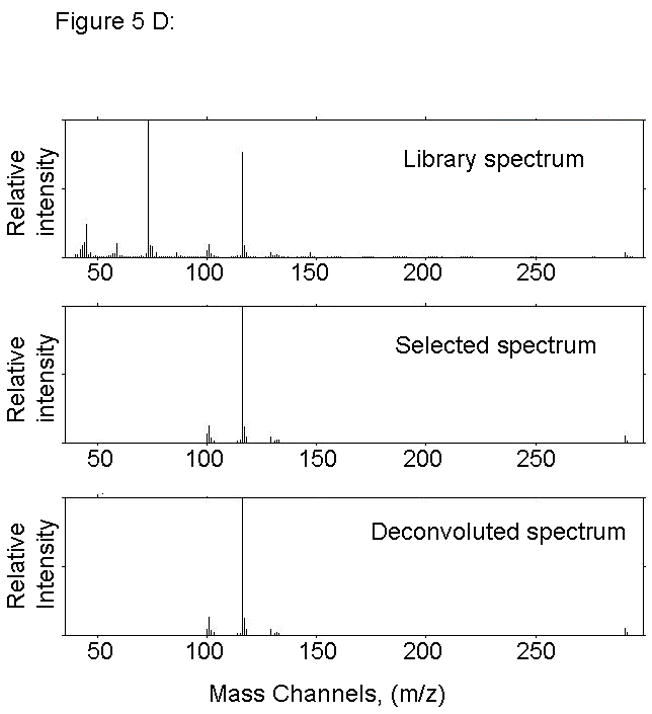
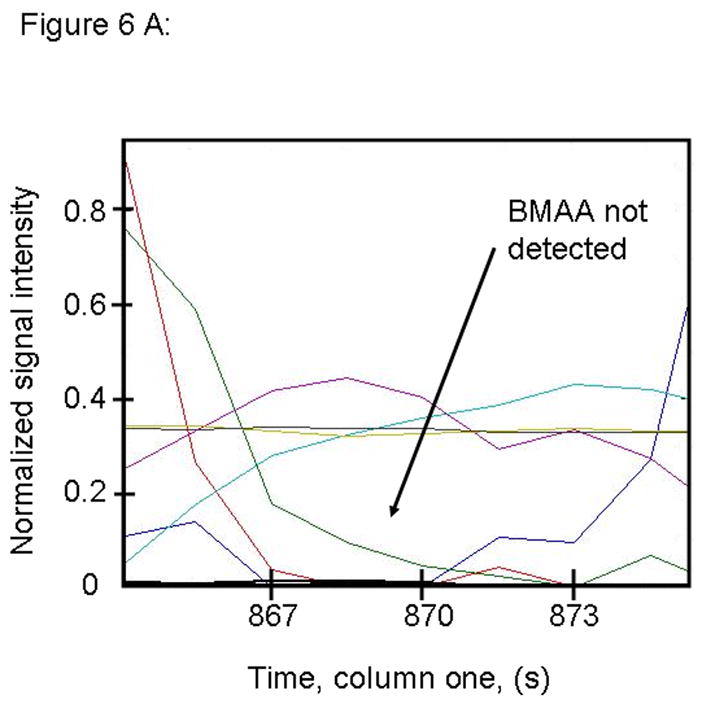
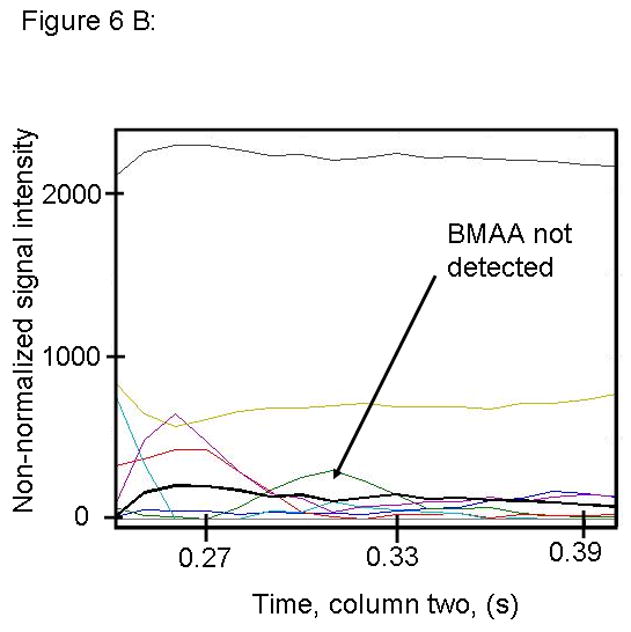
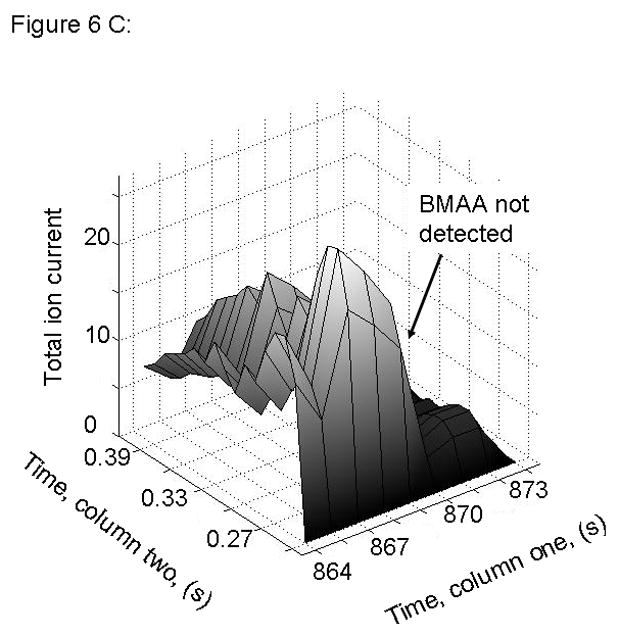
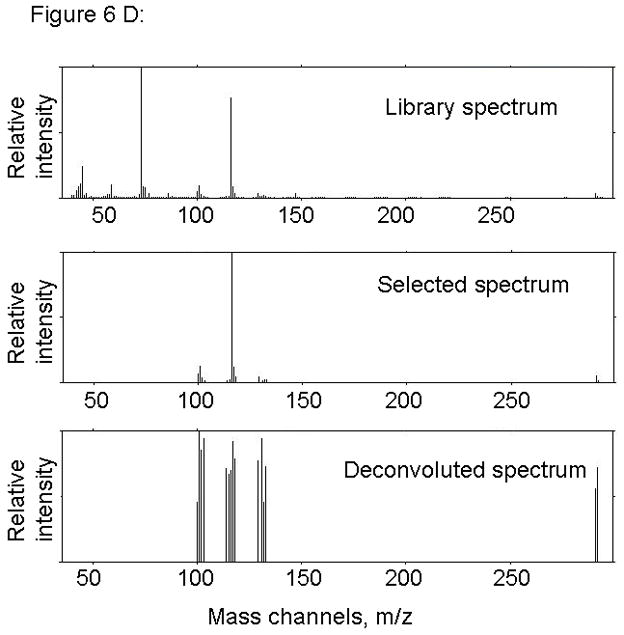
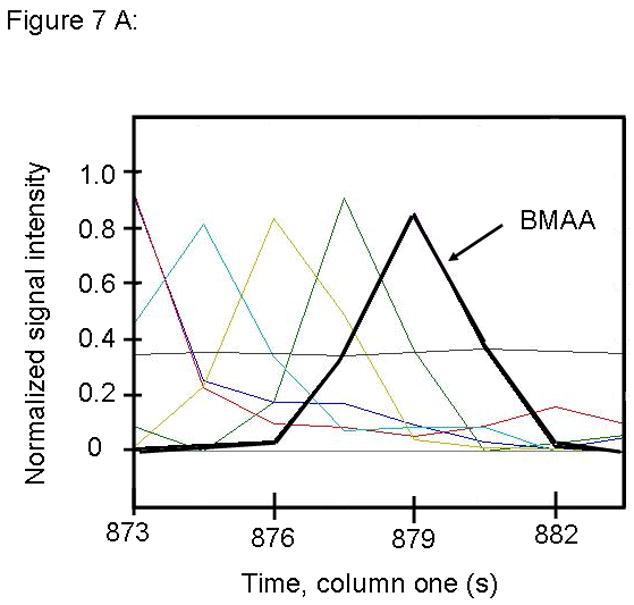
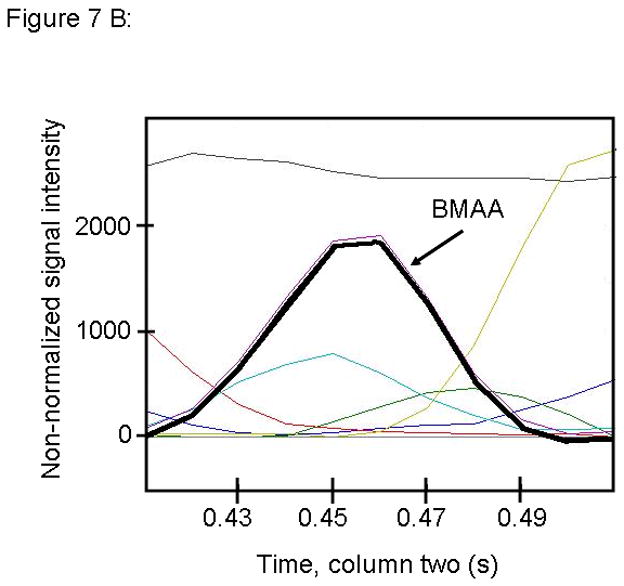
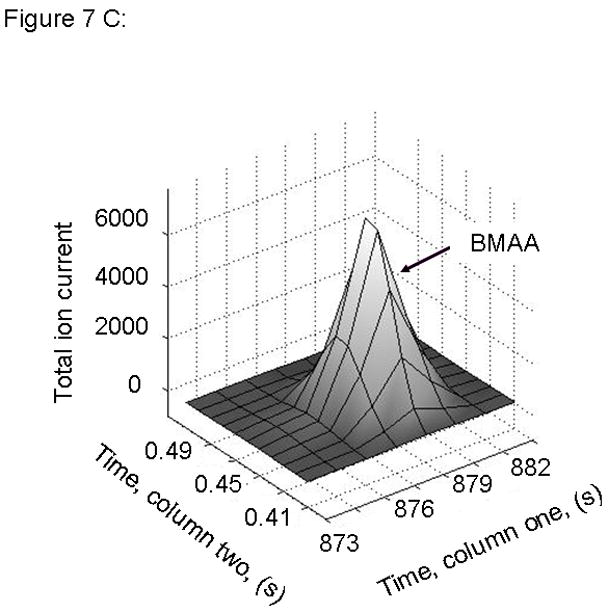
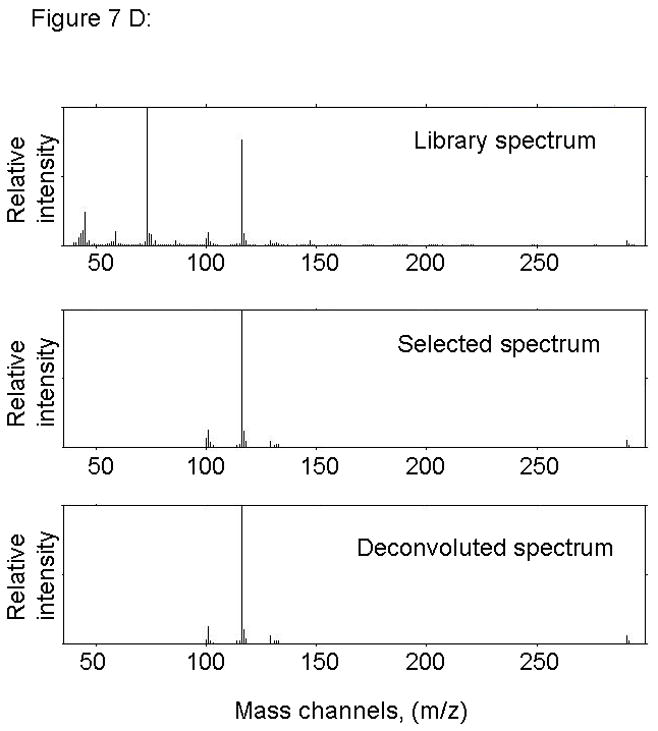
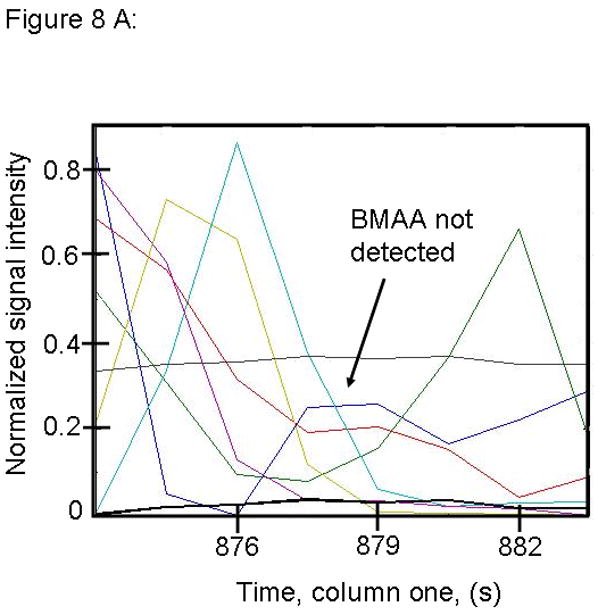
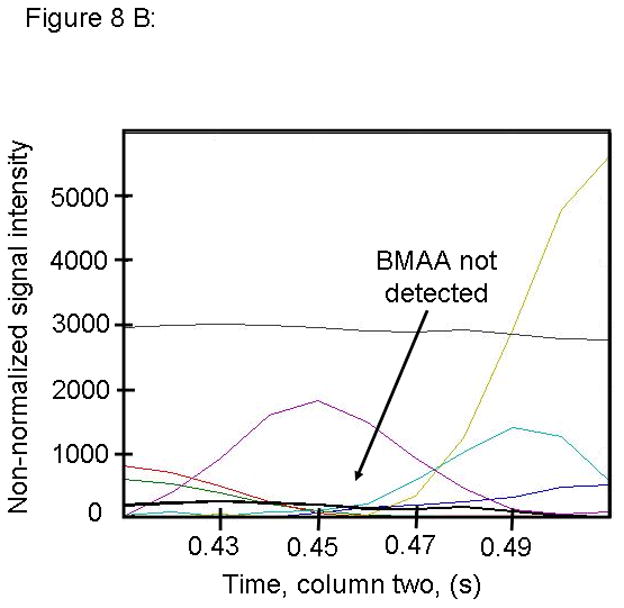
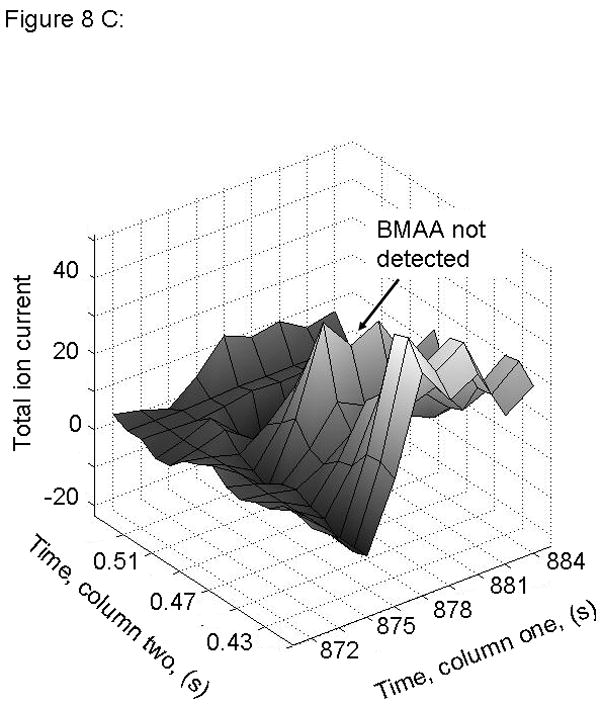
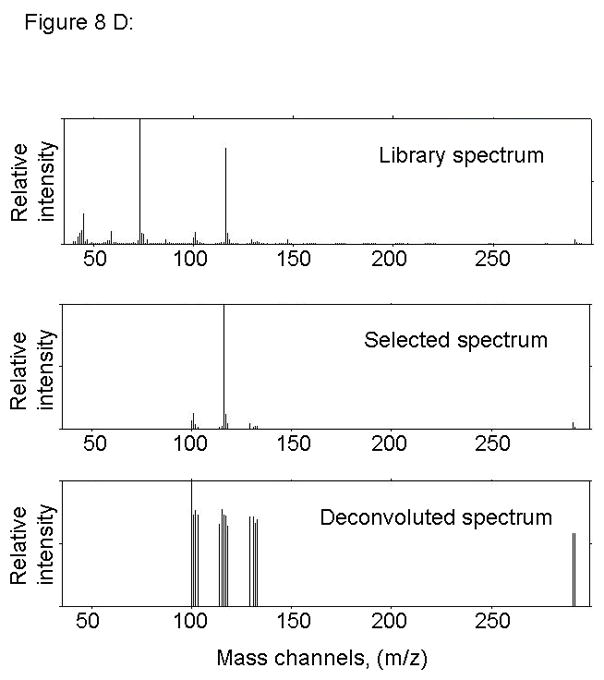
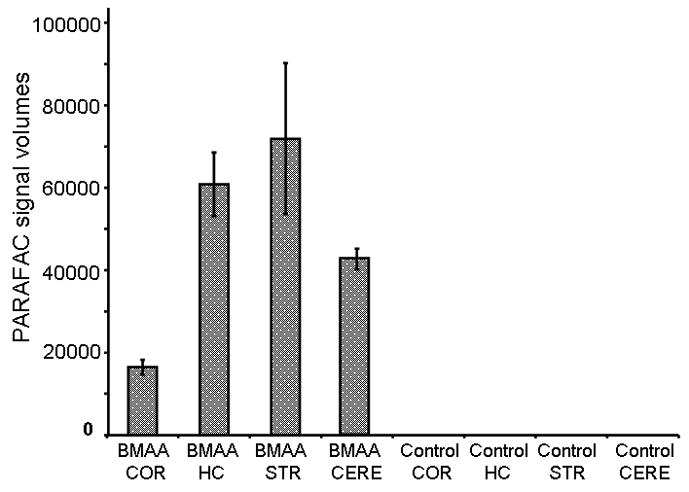
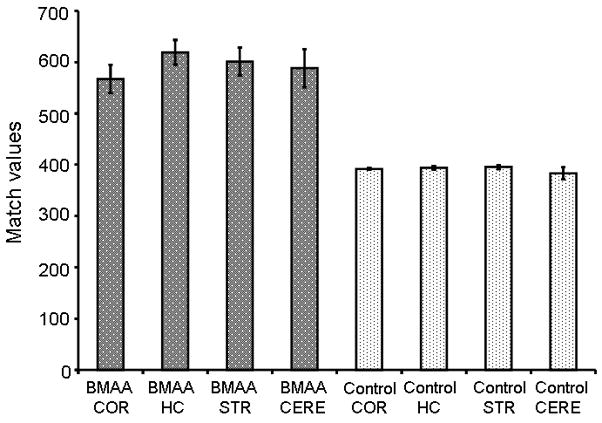
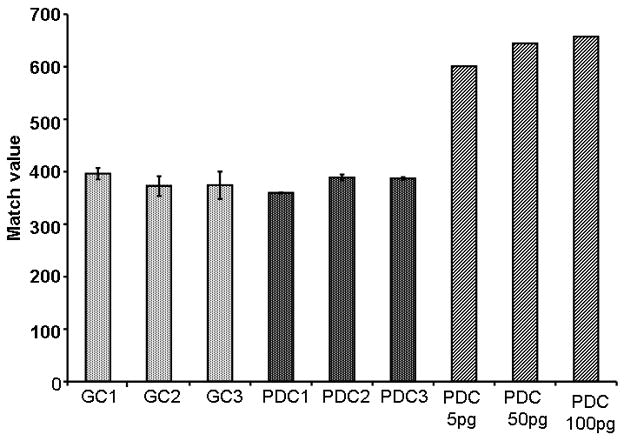
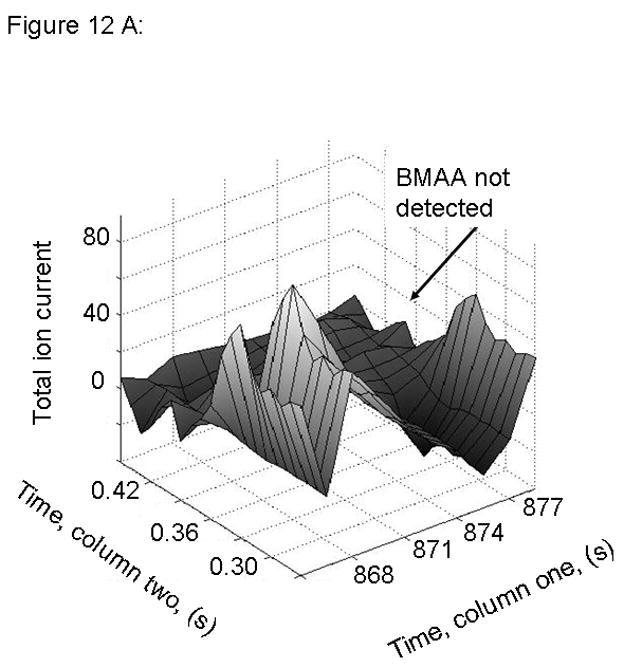
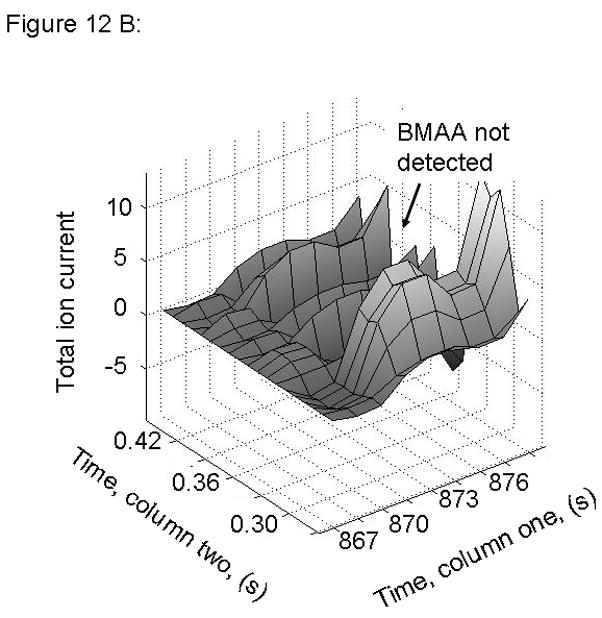
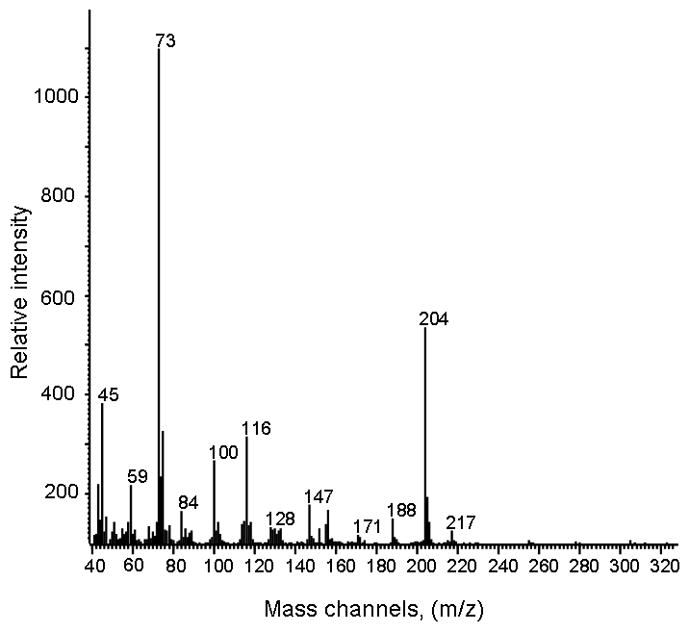
L-Beta-methylamino-alanine (BMAA) has been proposed as a worldwide contributor to neurodegenerative diseases, including Parkinson dementia complex (PDC) of Guam and Alzheimer's disease (AD). Recent conflicting reports of the presence of this amino acid in human brain from patients affected by these diseases have made it necessary to develop methods that provide unambiguous detection in complex samples. Comprehensive two-dimensional gas chromatography coupled with time-of-flight-mass-spectrometry analysis (GCxGC-TOFMS) followed by a targeted Parallel Factor Analysis (PARAFAC) deconvolution method has been used recently in metabolomic investigations to separate, identify, and quantify components of complex biological specimens. We have extended and applied this methodology to the toxicological problem of detecting BMAA in extracts of brain tissue. Our results show that BMAA can be isolated from closely eluting compounds and detected in trace amounts in extracts of brain tissue spiked with low levels of this analyte, ranging from 2.5ppb to 50ppb, with a limit of detection (LOD) of 0.7ppb. This new method was sufficiently sensitive to detect BMAA in cerebral extracts of mice fed BMAA. This optimized approach was then applied to analyze tissue from humans; however, no BMAA was detected in the brain extracts from controls or patients with PDC or AD. Our results demonstrate the application of multidimensional chromatography-mass spectrometry methods and computational deconvolution analysis to the problem of detecting trace amounts of a potential toxin in brain extracts from mice and humans.


Figures

Figure 1
Figure 1
This image shows raw GC × GC-TOFMS data of m/z 73 from extracted cerebrum samples from (A) human and (B) mouse. These data demonstrate the importance of comprehensive separation, as resolution of co-eluting compounds can be achieved by two dimensional chromatography.
Figure 1
Figure 1
This image shows raw GC × GC-TOFMS data of m/z 73 from extracted cerebrum samples from (A) human and (B) mouse. These data demonstrate the importance of comprehensive separation, as resolution of co-eluting compounds can be achieved by two dimensional chromatography.
Figure 2
Figure 2
Electron impact ionization mass spectrum of derivatized BMAA.
Figure 3
Figure 3
Calibration curve obtained by standard addition method of spiking L-beta methylamino alanine (BMAA) into human cerebrum extracts.
Figure 4
Figure 4
Mass spectral match values are observed to increase with concentration, until an optimal limit is reached.
Figure 5
Figure 5
PARAFAC signal intensity for cerebrum standard containing BMAA that was added to the matrix in (A) Column one retention time window, and (B) Column two retention time window. (C) PARAFAC reconstructed total ion current (TIC) signal showing identified BMAA peak. (D) Mass spectral data from PARAFAC showing library template matching the deconvoluted BMAA peak. Non-bold lines in panels (A) and (B) indicate loadings (i.e., deconvoluted responses) that are due to noise, baseline, or other analytes. See ref [32].
Figure 5
Figure 5
PARAFAC signal intensity for cerebrum standard containing BMAA that was added to the matrix in (A) Column one retention time window, and (B) Column two retention time window. (C) PARAFAC reconstructed total ion current (TIC) signal showing identified BMAA peak. (D) Mass spectral data from PARAFAC showing library template matching the deconvoluted BMAA peak. Non-bold lines in panels (A) and (B) indicate loadings (i.e., deconvoluted responses) that are due to noise, baseline, or other analytes. See ref [32].
Figure 6
Figure 6
PARAFAC signal intensity for cerebrum standard that does not contain BMAA in (A) Column one retention time window, and (B) Column two retention time window. (C) PARAFAC reconstructed total ion current (TIC) showing lack of BMAA peak. (D) Mass spectral data from PARAFAC analysis shows that BMAA was not detected. Non-bold lines in panels (A) and (B) indicate loadings that are due to noise, baseline, or other analytes See ref [32].
Figure 6
Figure 6
PARAFAC signal intensity for cerebrum standard that does not contain BMAA in (A) Column one retention time window, and (B) Column two retention time window. (C) PARAFAC reconstructed total ion current (TIC) showing lack of BMAA peak. (D) Mass spectral data from PARAFAC analysis shows that BMAA was not detected. Non-bold lines in panels (A) and (B) indicate loadings that are due to noise, baseline, or other analytes See ref [32].
Figure 7
Figure 7
PARAFAC signal intensity from mouse cerebrum sample from the BMAA diet fed group in (A) Column one retention time window, and (B) Column two retention time window. (C) Total ion current showing identified BMAA peak. (D) Mass spectral data from PARAFAC for this sample show a matching mass spectrum for BMAA. Non-bold lines in panels (A) and (B) indicate loadings that are due to noise, baseline, or other analytes. See ref [32].
Figure 7
Figure 7
PARAFAC signal intensity from mouse cerebrum sample from the BMAA diet fed group in (A) Column one retention time window, and (B) Column two retention time window. (C) Total ion current showing identified BMAA peak. (D) Mass spectral data from PARAFAC for this sample show a matching mass spectrum for BMAA. Non-bold lines in panels (A) and (B) indicate loadings that are due to noise, baseline, or other analytes. See ref [32].
Figure 8
Figure 8
PARAFAC signal intensity from mouse cerebrum from control diet group in (A) Column one retention time window, and (B) Column two retention time window. (C) Total ion current showing lack of BMAA peak. (D) Mass spectral data from PARAFAC for this sample indicating that BMAA was not detected in this sample. Non-bold lines in panels (A) and (B) indicate loadings that are due to noise, baseline, or other analytes. See ref [32].
Figure 8
Figure 8
PARAFAC signal intensity from mouse cerebrum from control diet group in (A) Column one retention time window, and (B) Column two retention time window. (C) Total ion current showing lack of BMAA peak. (D) Mass spectral data from PARAFAC for this sample indicating that BMAA was not detected in this sample. Non-bold lines in panels (A) and (B) indicate loadings that are due to noise, baseline, or other analytes. See ref [32].
Figure 9
Figure 9
PARAFAC peak signal volumes for mouse brain samples for BMAA fed and Control diet fed mice. No BMAA was detected in any of the samples from mice fed a control diet. COR = Cortex, HC = Hippocampus, STR = Striatum, CERE = Cerebellum
Figure 10
Figure 10
Match values (MV) from PARAFAC signal output on mouse brain samples from BMAA fed and Control diet. Match values for real samples follow the trend of spiked samples, showing MV of 500-650 for BMAA positive samples and less than 400 for samples where BMAA was not detectable. COR = Cortex, HC = Hippocampus, STR = Striatum, CERE = Cerebellum.
Figure 11
Figure 11
Match values from a representative group of samples. Both Guamanian Control and Parkinson Dementia Complex (PDC) tissues were used in this study. Analysis of both groups reveal that BMAA is not at any detectable levels using this method. Low levels of BMAA (5 pg, 50 pg, and 100 pg) are spiked into PDC tissue, the match value PARAFAC output from the analysis increases. (GC = Guamanian Control Sample, PDC = Parkinson Dementia Complex Sample)
Figure 12
Figure 12
PARAFAC signal intensity from human cerebrum sample from Guamanian samples (A) Total ion current showing lack of BMAA peak for PDC affected sample and (B) Total ion current showing lack of BMAA peak for PDC Control sample.
Figure 12
Figure 12
PARAFAC signal intensity from human cerebrum sample from Guamanian samples (A) Total ion current showing lack of BMAA peak for PDC affected sample and (B) Total ion current showing lack of BMAA peak for PDC Control sample.
Figure 13
Figure 13
Electron impact ionization mass spectrum of derivatized chromatographically overlapping compound, showing distinct differences from BMAA (Figure 2 for comparison).

Similar articles

Cited by

References

    1. Morris HR, Steele JC, Crook R, Wavrant-De Vrieze F, Onstead-Cardinale L, Gwinn-Hardy K, Wood NW, Farrer M, Lees AJ, McGeer PL, Siddique T, Hardy J, Perez-Tur J. Arch Neurol. 2004;61:1889. - PubMed
    1. Plato CC, Galasko D, Garruto RM, Plato M, Gamst A, Craig UK, Torres JM, Wiederholt W. Neurology. 2002;58:765. - PubMed
    1. Galasko D, Salmon DP, Craig UK, Thal LJ, Schellenberg G, Wiederholt W. Neurology. 2002;58:90. - PubMed
    1. Waring SC. School of Public Health. University of Texas Health Science Center; Houston: 1994.
    1. Vega A, Bell EA. Phytochemistry. 1967;6:759.

Publication types

Substances

LinkOut - more resources