. 2010 Jun 15;184(12):6637-48.
doi: 10.4049/jimmunol.0902784. Epub 2010 May 14.

Increased hematopoietic cells in the mertk-/- mouse peritoneal cavity: a result of augmented migration

Affiliations

Increased hematopoietic cells in the mertk-/- mouse peritoneal cavity: a result of augmented migration

Julie C Williams et al. J Immunol. .

Abstract

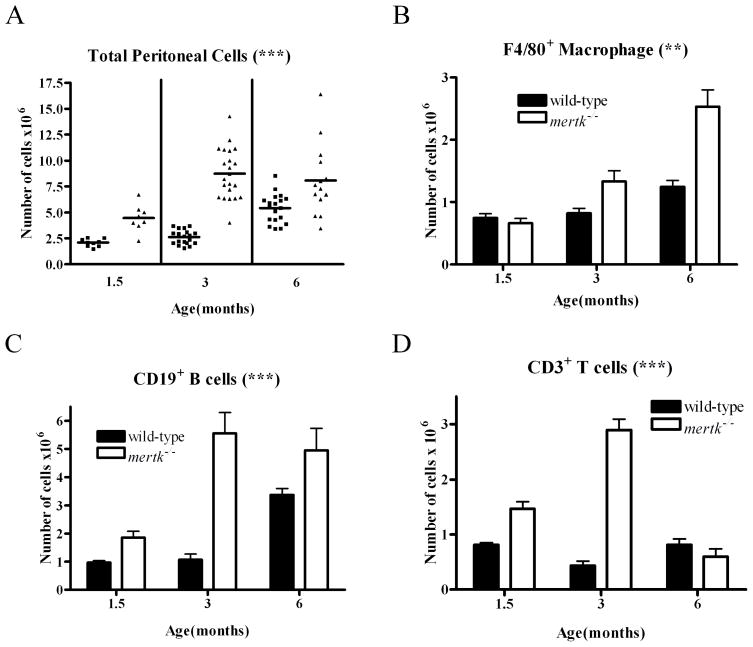
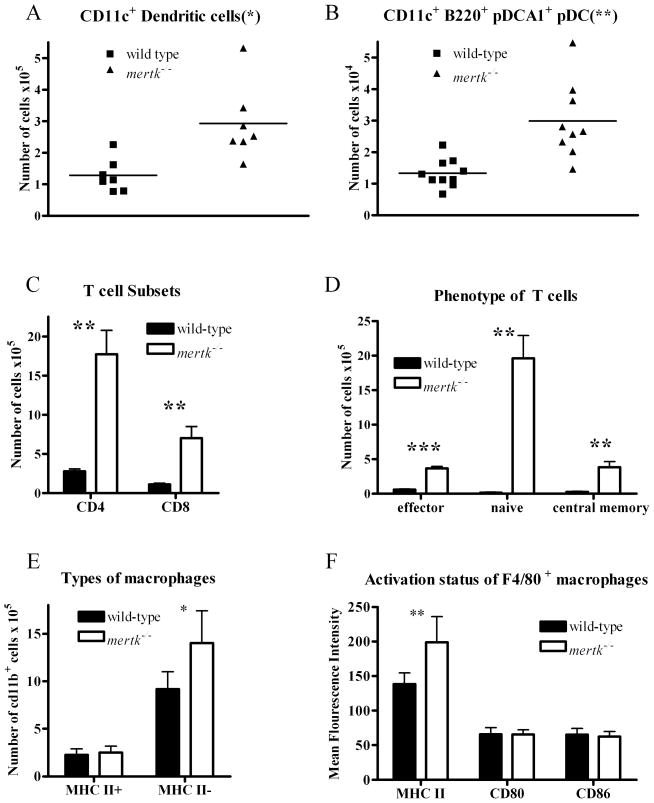
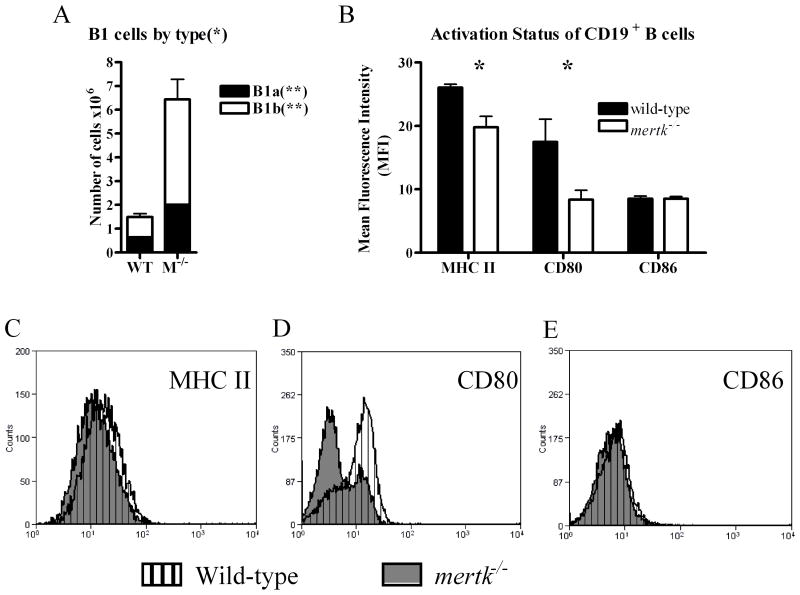
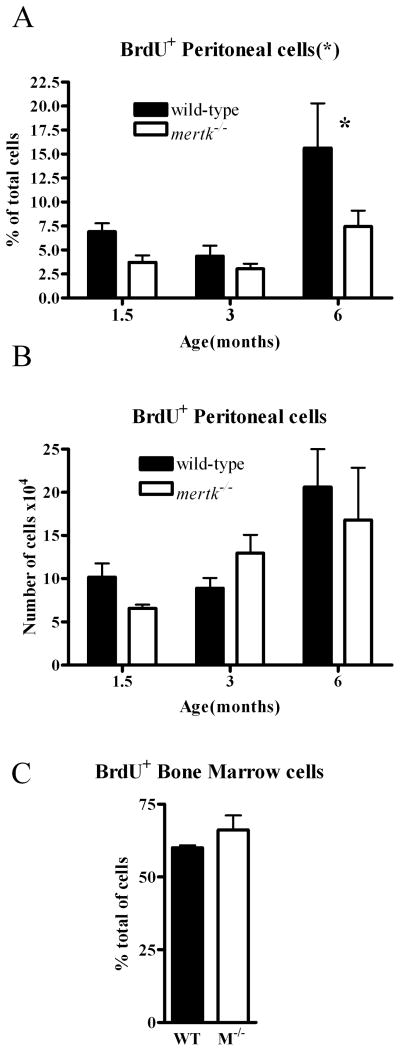
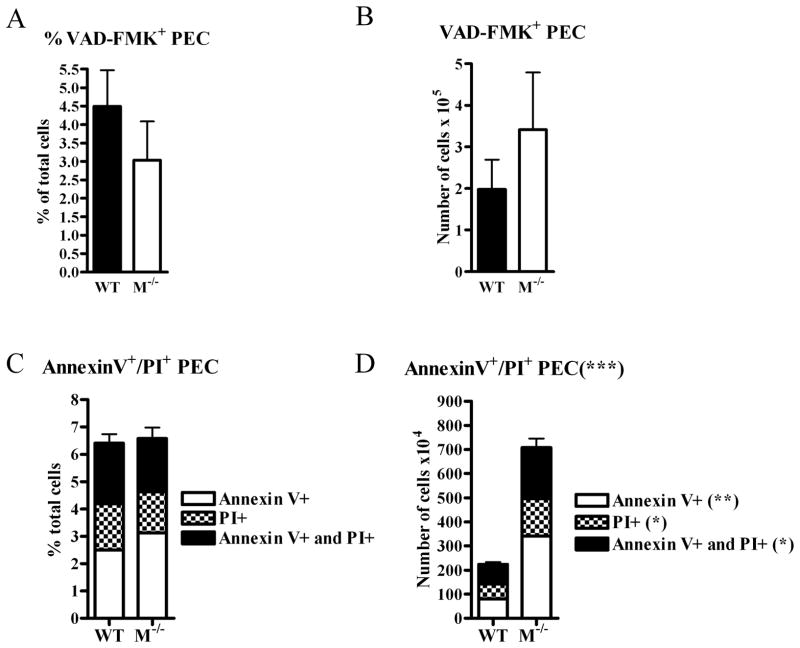
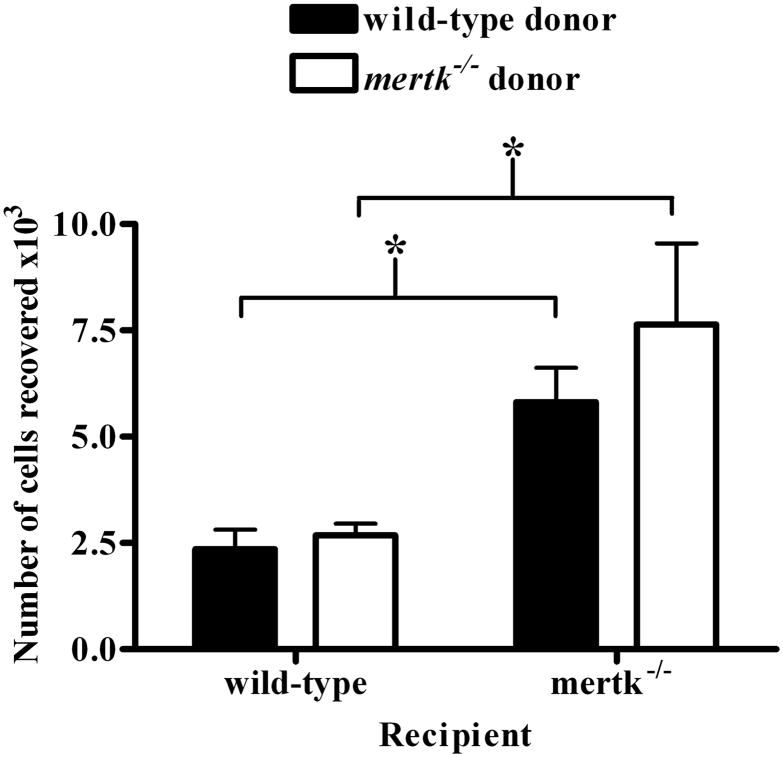
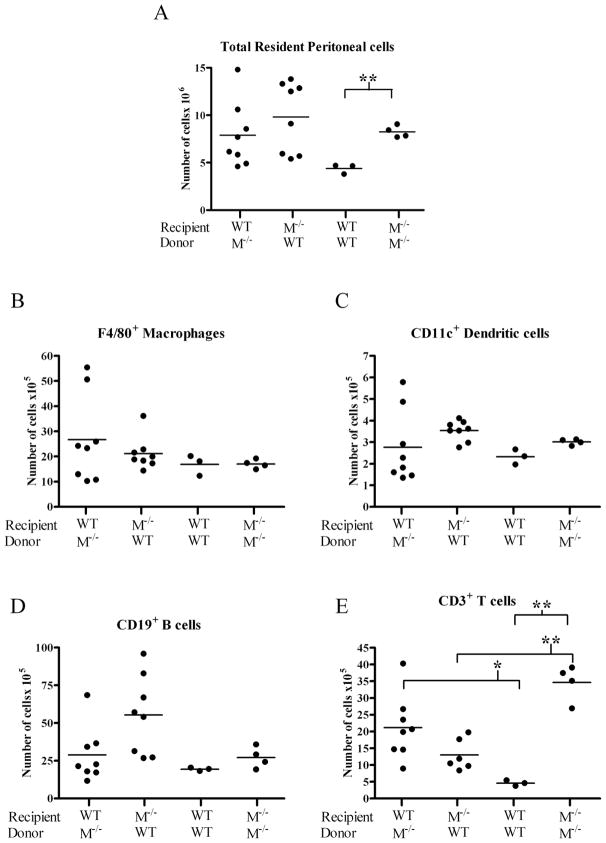
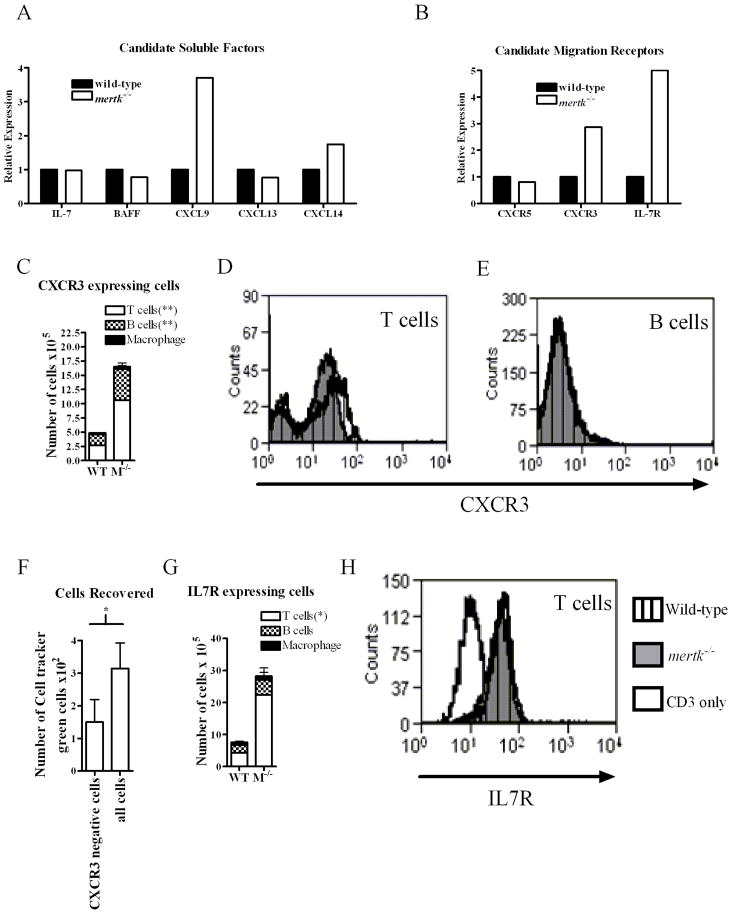
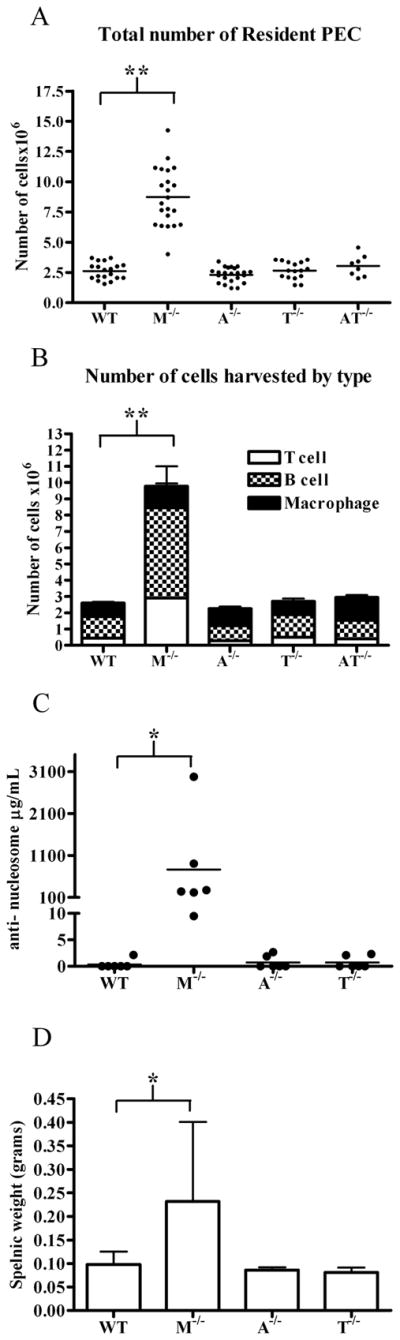
The peritoneal cavity is recognized as an important site for autoreactive B cells prior to their transit to other immune tissues; however, little is known of the genes that may regulate this process. Mice lacking the receptor tyrosine kinase, Mertk, display a lupus-like autoimmune phenotype with splenomegaly and high autoantibodies titers. In this study, we investigate whether Mertk regulates the composition of peritoneal cells that favor an autoimmune phenotype. We found an increase in the number of macrophages, dendritic cells (DCs), plasmacytoid DCs, T cells, and B cells in the peritoneal cavity of mertk-/- mice when compared with wild-type mice. This disparity in cell numbers was not due to changes in cell proliferation or cell death. In adoptive transfer experiments, we showed an increase in migration of labeled donor cells into the mertk-/- peritoneal cavity. In addition, bone marrow chimeric mice showed hematopoietic-derived factors were also critical for T cell migration. Consistent with this migration and the increase in the number of cells, we identified elevated expression of CXCL9, its receptor CXCR3, and IL-7R on peritoneal cells from mertk-/- mice. To corroborate the migratory function of CXCR3 on cells, the depletion of CXCR3 donor cells significantly reduced the number of adoptively transferred cells that entered into the peritoneum of mertk-/- mice. This control of peritoneal cells numbers correlated with autoantibody production and was exclusively attributed to Mertk because mice lacking other family members, Axl or Tyro 3, did not display dysregulation in peritoneal cell numbers or the autoimmune phenotype.


Figures

Figure 1
Figure 1. Increase in peritoneal cellular populations in the mertk−/− mouse
PEC were harvested from male mice at indicated ages and quantified by flow cytometry. A) Total number of PEC from wild-type (■) and mertk−/− (▲) mice were counted. B) The total number of F4/80+ macrophages, C) The total number of CD19+ B cells, and D) The total number of CD3+ T cells were also examined. *** p<0.0001 by 2-way ANOVA comparing wild-type to mertk−/− mice. n≥6 ** p<0.001 by 2-way ANOVA comparing wild-type to mertk−/− mice.
Figure 2
Figure 2. Increase in DC, pDC, and T cells by subset in mertk−/− peritoneal cavity
Cells were stained and quantified by flow cytometry. A)PEC were stained for CD11c+ DC or B) CD11c+ B220+ PDCA1+ plasmacytoid DC. C) PEC were stained for CD4+ T cells and CD8+ T cells. D) PEC were stained for Effector T cells (CD44hi CD62Llo), Naive T cells (CD44lo CD62Lhi), and Central Memory T cells (CD44hi CD62Lhi) T cells (CD3+). E) PECs were stained for CD11b+ (macrophages) and MHC II. F) PECs were stained for F4/80+ macrophages and MHC II, CD80 or CD86. The sample number is n ≥4. Statistical significance was analyzed by Students t-test comparing samples from wild-type and mertk−/− mice. p-values are: *p<0.05; **p<0.005; and ***p<0.0001.
Figure 3
Figure 3. Increase in B1 cell populations and lower B cell maturation status in mertk−/−peritoneal cavity
A) PEC were stained for B1a (CD19+ CD11b+ CD5+) and B1b (CD19+ CD11b+ CD5) cells. B) PEC were stained with CD19 to identify B cells and then double labeled with MHC II, CD80 and CD86. The Mean Fluorescence Intensity on CD19+ cells was graphed. The number of samples is n ≥4. Statistical significance by Students t-test was *p<0.05 and **p<0.005.
Figure 4
Figure 4. Increase in cells is not due to proliferation
Proliferating PEC were identified by their incorporation of BrdU. PEC were collected after injection of BrdU I.P. and stained with anti-BrdU antibody. (A) Percent and (B) total number of BrdU+ cells across aged mice from 1.5 months to 6 months were examined. n≥6. C) Bone marrow cells from wild-type (WT) or mertk−/− (M−/−) mice were stained for BrdU incorporation and the data is expressed as the percent of BrdU+ cells, n ≥ 3 and representative of at least 2 separate experiments. Statistical significance is * p<0.05 by 2-way ANOVA. * p<0.05 by Bonferroni’s post-test.
Figure 5
Figure 5. Increase in cells is not due to cell death
3 month old mice were injected with VAD-FMK-FITC 1 hour prior to PEC harvest to detect caspase-positive cells. Cells were analyzed by flow cytometry. (A)The percent VAD-FMK+ cells, and (B) the total number of VAD-FMK+ cells were examined. PEC were harvested from 3 month old mice, stained with Annexin V-FITC and PI, and subsequently analyzed by flow cytometry. Data is expressed as (C) percent or (D) total number of Annexin-V+ or PI+ PEC. For each experiment, n ≥ 4. Statistical significance comparing samples from wild-type and mertk−/−mice is *** p<0.0001 by 2-way ANOVA. (**) p<0.001 by Bonnferoni’s post-test. (*) p<0.05 by Bonnferoni’s post-test.
Figure 6
Figure 6. Enhanced migration to mertk−/− peritoneal cavity
Indicated donor PECs were harvested, stained with Cell Tracker green and injected via tail vein into recipient mice. PEC were harvested from 24 hrs after injection and analyzed by flow cytometry. The majority of donor cells recovered were lymphocytes based on forward scatter and side scatter analysis (data not shown). Data is expressed as number of Cell Tracker green positive cells recovered from recipient peritoneum. n ≥ 10. Statistical significance is * p<0.01 by Students t-test.
Figure 7
Figure 7. Both hematopoietic and non-hematopoietic sources are required for cellular increase in mertk−/− peritoneal cavity
Recipient 4 week old mice were lethally irradiated and given indicated donor bone marrow 1 day later. At 3 months of age PEC were collected and (A) total cell number was counted. Cells were then stained for (B) F4/80+ macrophage, (C) CD11c+ DC, (D) CD19+ B cells, and (E) CD3+ T cells. WT = wild-type M−/− = mertk−/− mice. Statistical significance using the Student’s t-test * p< 0.05 and ** p<0.0005.
Figure 8
Figure 8. Expression of chemokines, cytokines, and migration receptors in PEC
PEC were pooled from at least 4 three month old male mice. RNA was harvested and reverse transcribed to cDNA. A) Real-time PCR was performed for soluble molecules, IL-7, BAFF, CXCL9, CXCL13, and CXCL14. B) Real-time PCR was performed for receptors, CXCR5, CXCR3, and IL-7R. C) PEC from wild-type and mertk−/− mice were double-stained for CD3, CD19, or F480 and CXCR3. Representative histograms of CXCR3 expression gated on CD3+ T cells (D) or CD19+ B cells (E). F) PECs were stained and sorted on the basis of CXCR3 expression. Either CXCR3-negative sorted cells or all cells sorted from mertk−/− donors were stained with cell tracker green and adoptively transferred into mertk−/− recipients. G) PEC from wild-type and mertk−/− mice were double-stained for CD3, CD19, or F4/80 and IL-7R. H) Representative histograms of IL-7R expression CD3+ cells. Mean and standard deviation are graphed. n ≥ 3 per genotype per panel. Statistical significance are indicated, *p<0.05, **p<0.005 by the Student’s t test when comparing wild-type vs mertk−/− mice.
Figure 9
Figure 9. Increase in peritoneal cells and autoantibody production is due to Mertk and not Axl or Tyro3
PEC were harvested from 3 month old male mice from wild-type (WT), mertk−/− (M−/−), axl−/− (A−/−), tyro3−/− (T−/−), axl−/−/tyro3−/− (AT−/−). A) Total cells were counted and stained for B) F4/80+ macrophage, CD19+ B cells and CD3+ T cells. C) Anti-nucleosome antibody titers were determined by ELISA from serum of mice 6 months of age or older D) Splenic weight was measured from mice 6 months of age or older. n ≥ 6 No statistically significant differences were found by ANOVA with post-tests between WT, A−/−, T−/− and AT−/− peritoneal cells. Statistical significance is indicated in comparisons with samples from wild type and mertk−/− mice, *p<.01 **p<.001 by ANOVA post-test.

References

    1. Broche F, Tellado JM. Defense mechanisms of the peritoneal cavity. Curr Opin Crit Care. 2001;7:105–116. - PubMed
    1. Finlay-Jones JJ, Davies KV, Sturm LP, Kenny PA, Hart PH. Inflammatory processes in a murine model of intra-abdominal abscess formation. J Leukoc Biol. 1999;66:583–587. - PubMed
    1. Berland R, Wortis HH. Origins and functions of B-1 cells with notes on the role of CD5. Annu Rev Immunol. 2002;20:253–300. - PubMed
    1. Tumang JR, Hastings WD, Bai C, Rothstein TL. Peritoneal and splenic B-1 cells are separable by phenotypic, functional, and transcriptomic characteristics. Eur J Immunol. 2004;34:2158–2167. - PubMed
    1. Viau M, Zouali M. B-lymphocytes, innate immunity, and autoimmunity. Clin Immunol. 2005;114:17–26. - PubMed

Publication types

MeSH terms