. 2010 Jun 15;184(12):6695-708.
doi: 10.4049/jimmunol.0903130. Epub 2010 May 14.

Dendritic cell-directed CTLA-4 engagement during pancreatic beta cell antigen presentation delays type 1 diabetes

Affiliations

Dendritic cell-directed CTLA-4 engagement during pancreatic beta cell antigen presentation delays type 1 diabetes

Subha Karumuthil-Melethil et al. J Immunol. .

Abstract

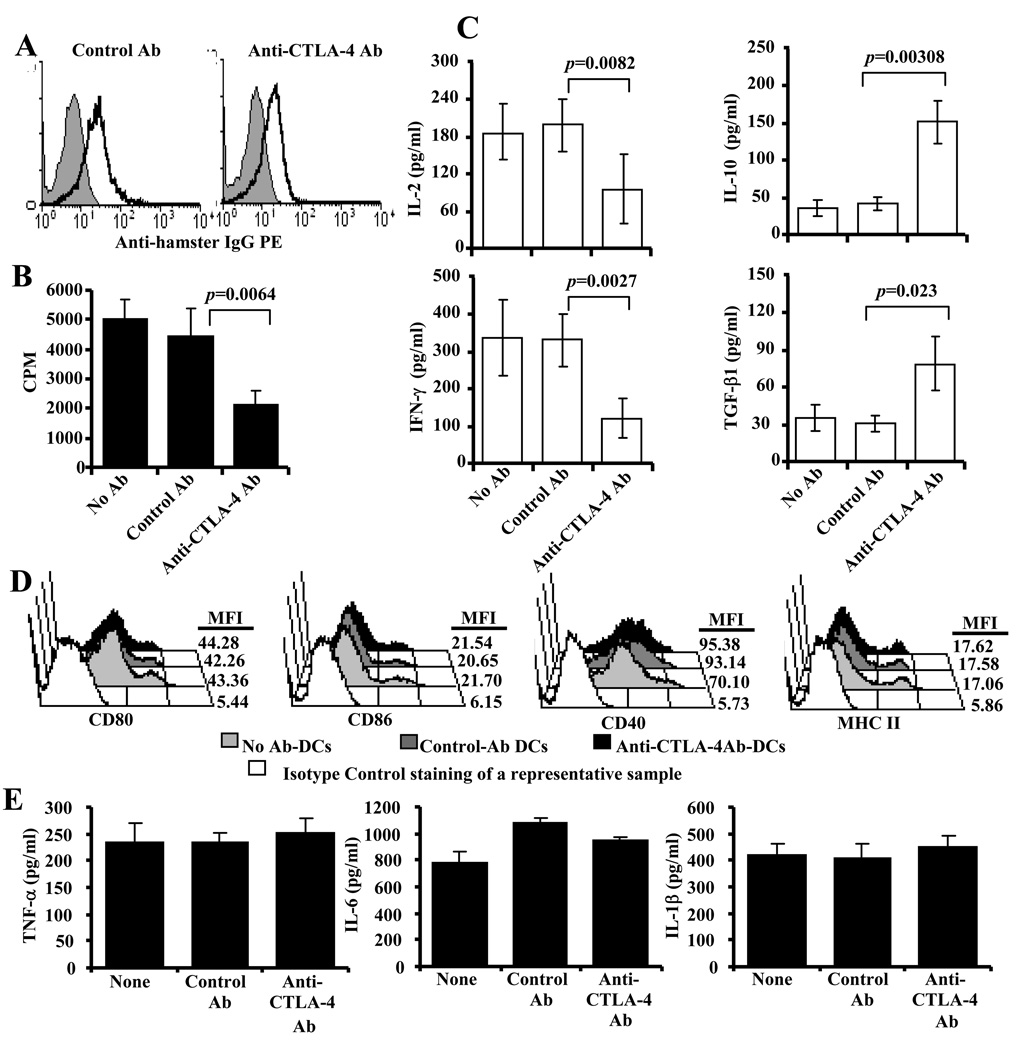
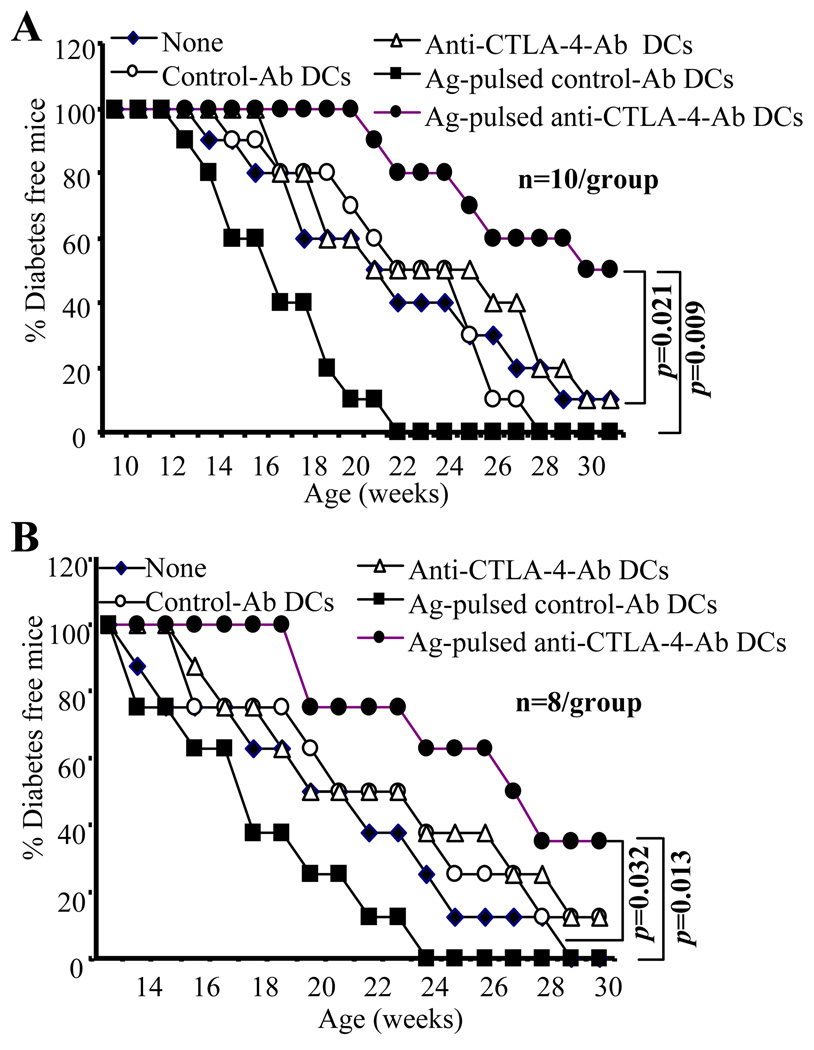
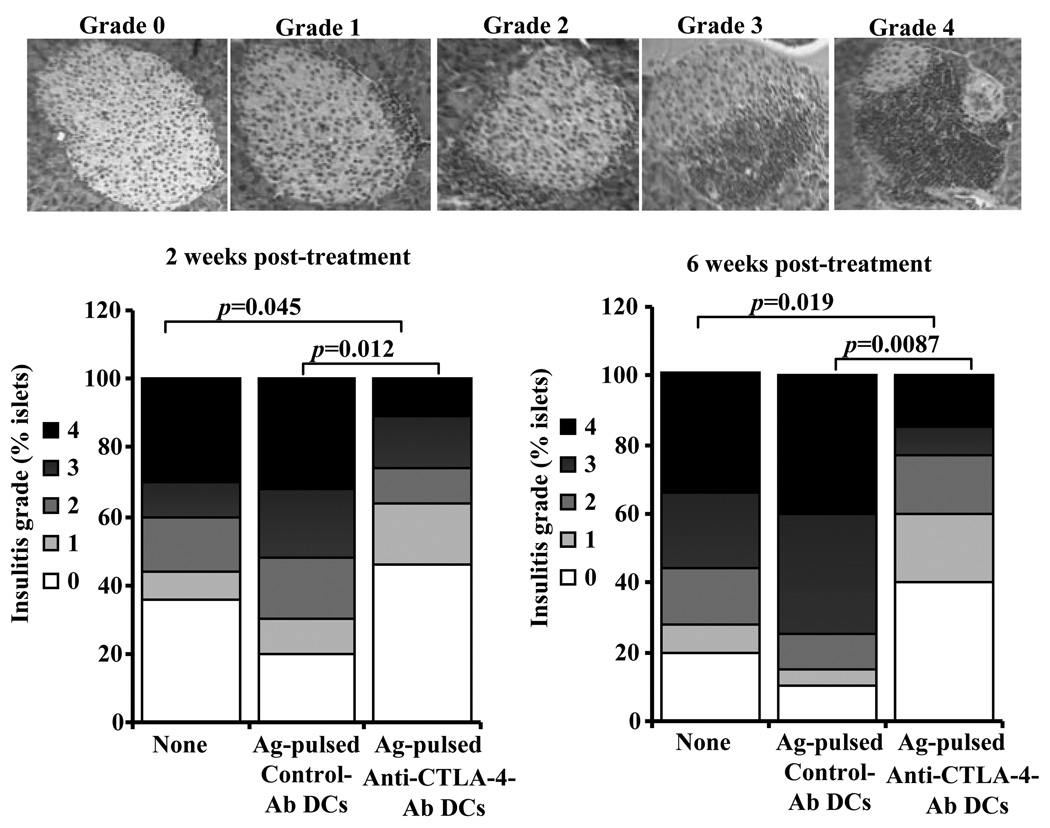
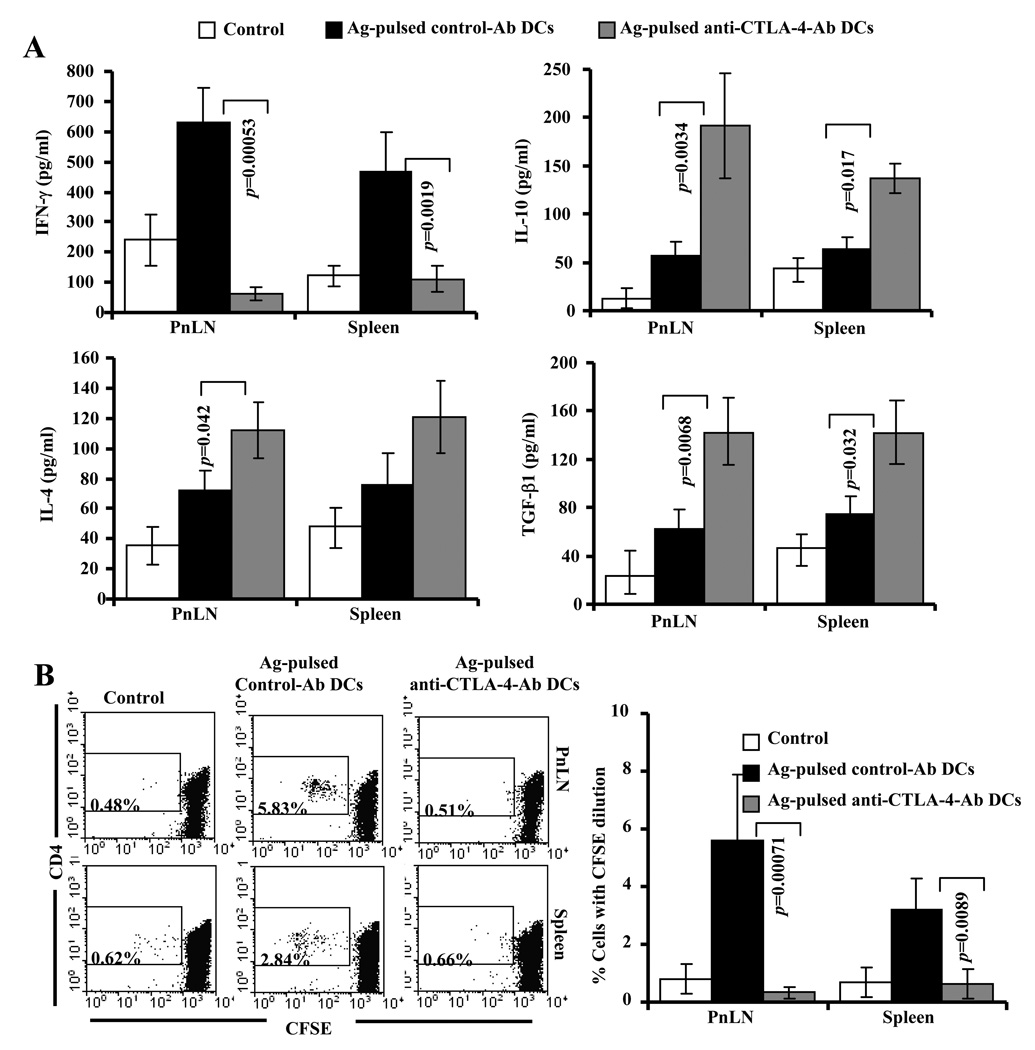
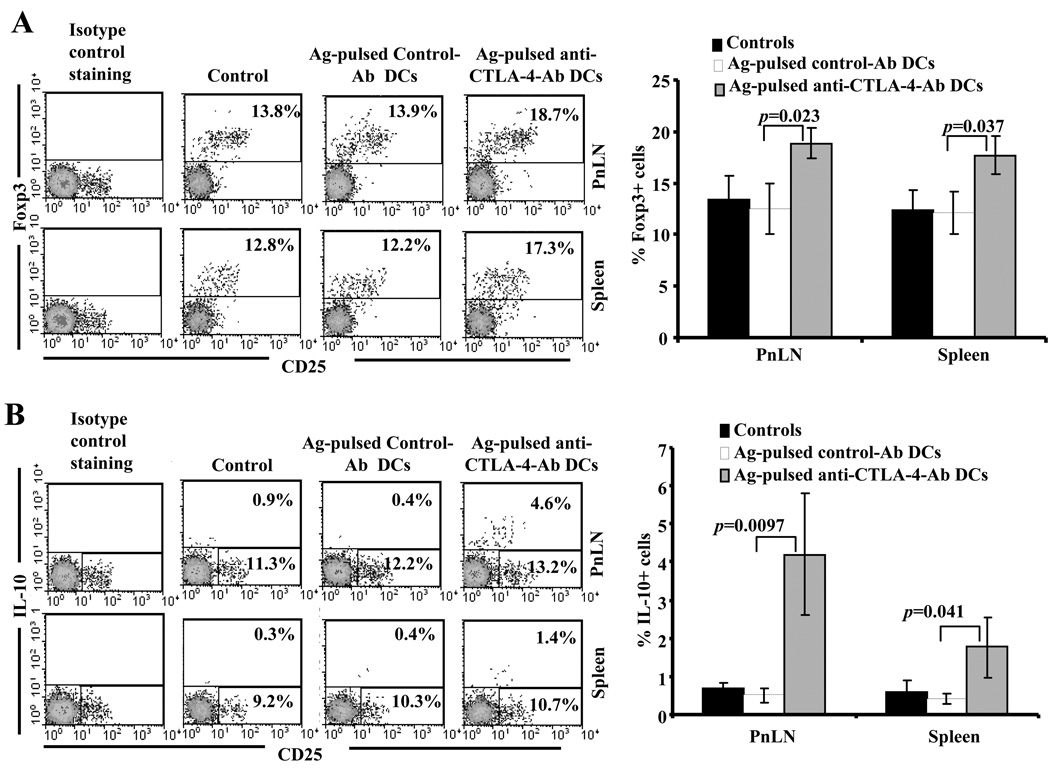
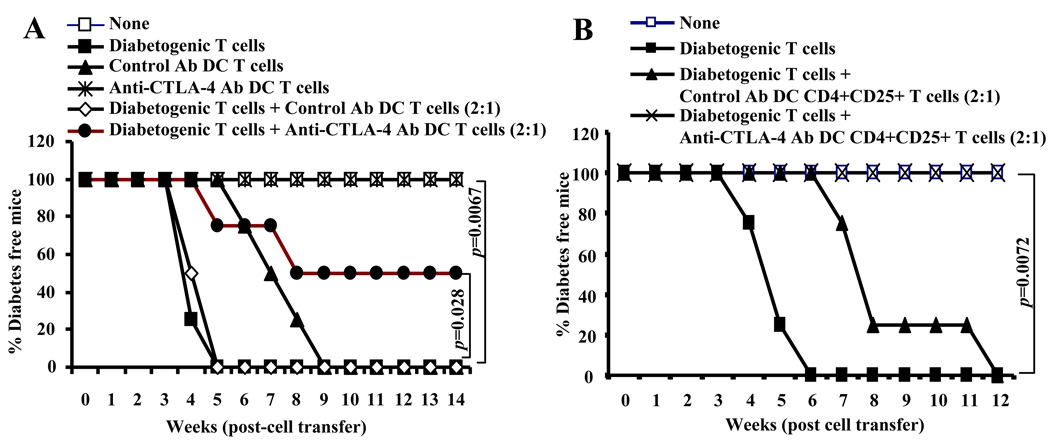
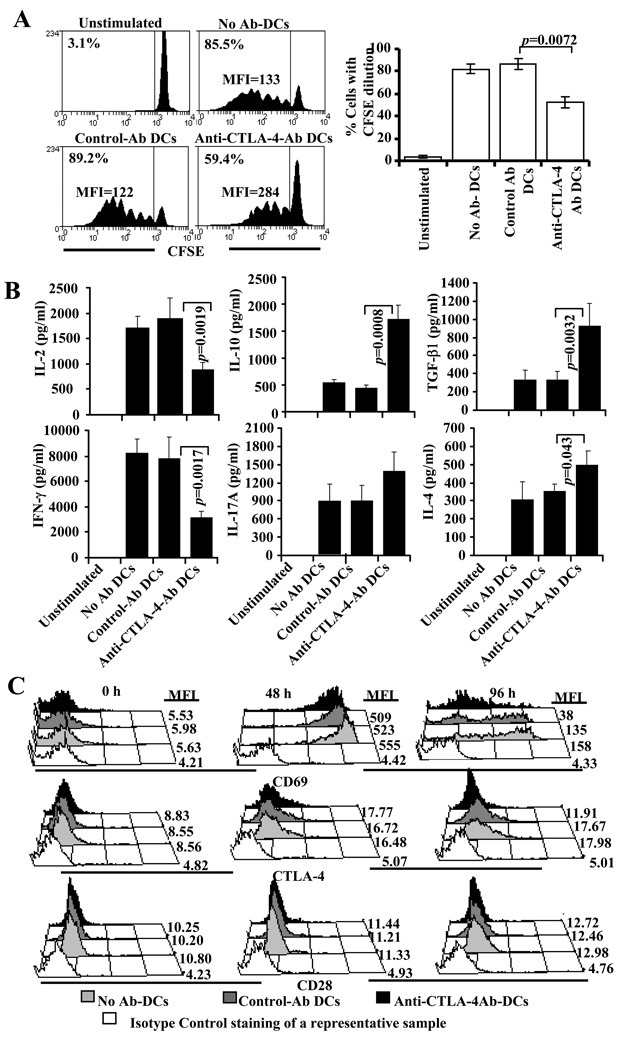
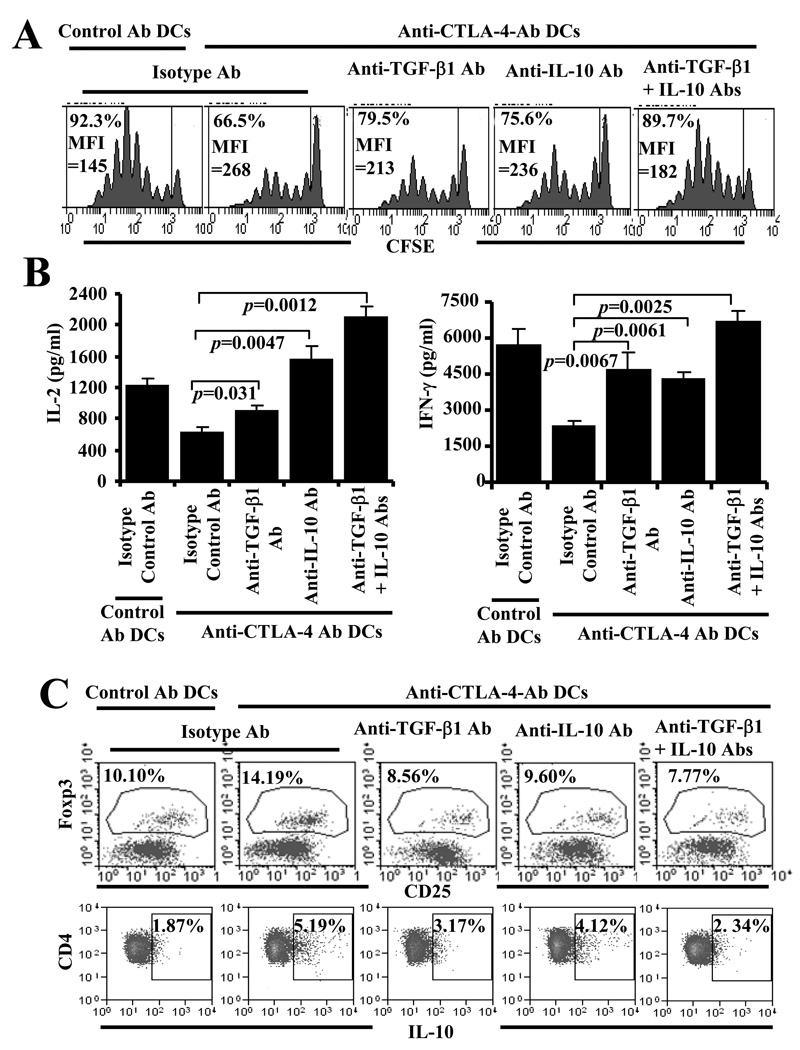
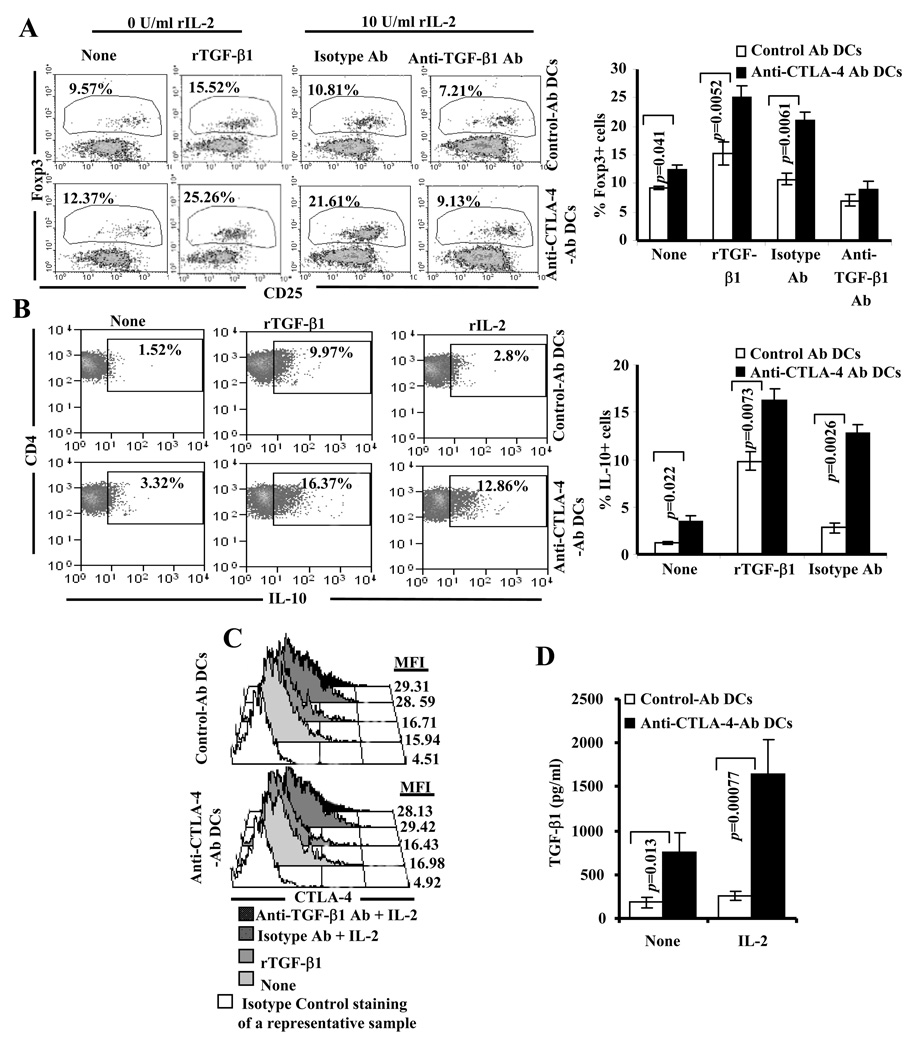
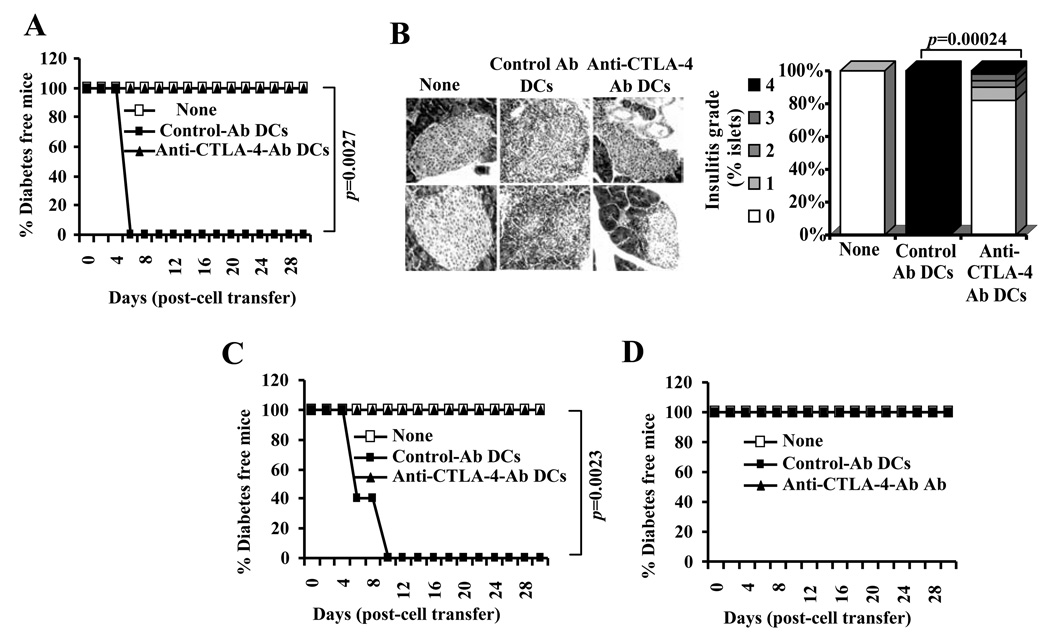
The levels of expression of alternatively spliced variants of CTLA-4 and insufficient CTLA-4 signaling have been implicated in type 1 diabetes. Hence, we hypothesized that increasing CTLA-4-specific ligand strength on autoantigen-presenting dendritic cells (DCs) can enhance ligation of CTLA-4 on T cells and lead to modulation of autoreactive T cell response. In this study, we show that DC-directed enhanced CTLA-4 engagement upon pancreatic beta cell Ag presentation results in the suppression of autoreactive T cell response in NOD mice. The T cells from prediabetic NOD mice treated with an agonistic anti-CTLA-4 Ab-coated DC (anti-CTLA-4-Ab DC) showed significantly less proliferative response and enhanced IL-10 and TGF-beta1 production upon exposure to beta cell Ags. Furthermore, these mice showed increased frequency of Foxp3+ and IL-10+ T cells, less severe insulitis, and a significant delay in the onset of hyperglycemia compared with mice treated with control Ab-coated DCs. Further analyses showed that diabetogenic T cell function was modulated primarily through the induction of Foxp3 and IL-10 expression upon Ag presentation by anti-CTLA-4-Ab DCs. The induction of Foxp3 and IL-10 expression appeared to be a consequence of increased TGF-beta1 production by T cells activated using anti-CTLA-4-Ab DCs, and this effect could be enhanced by the addition of exogenous IL-2 or TGF-beta1. Collectively, this study demonstrates the potential of a DC-directed CTLA-4 engagement approach not only in treating autoimmunity in type 1 diabetes, but also in altering diabetogenic T cell function ex vivo for therapy.


Figures

FIGURE 1
FIGURE 1
DC directed CTLA-4 engagement suppresses proliferation of T cells from diabetic NOD mice. BM DCs were generated, induced maturation using LPS for 48 h, pulsed with β-cell Ag, and coated with Abs as described in materials and methods. A) Control Ab (hamster IgG) and anti-CTLA-4 Ab coated BMDCs were tested for surface bound hamster IgG Ab by FACS. B) Purified splenic T cells from diabetic NOD mice (glucose: 250–400 mg/dl) were incubated with β cell Ag (a mixture of 5 immuno-dominant peptides; viz., 1. Insulin B(9–23), 2. GAD65(206–220), 3. GAD65(524–543), 4. IA-2beta(755–777) and 5. IGRP(123–145)) pulsed control and anti-CTLA-4 Ab DCs and tested for T cell proliferation. Cells were cultured for 48 h, pulsed with 3[H]-thymidine for an additional 18 h, harvested and tested for thymidine incorporation using a scintillation counter. Cultures in which DCs not pulsed with peptides were included as non-stimulated controls. Control Ab (hamster IgG) and anti-CTLA-4 Ab coated DCs were also used. C) Culture supernatants collected after 72 hours from an assay, similar to that described for A, were tested for cytokines IL-2, IFN-γ, IL-10, and TGF-β1 by ELISA. Background values (non-stimulated control) were subtracted from test values (peptide stimulated). Each bar represents mean±SD of the values of three individual mice tested in triplicate. D) Non-coated (none) and Ab coated DCs were incubated for additional 36 h, tested for surface markers by FACS. Mean fluorescence intensity (MFI) values of representative histograms are shown. E) 36 h supernatants from these cultures were tested for spontaneously (without additional stimulation) released cytokines by ELISA. Mean±SD values from a representative assay carried out in triplicate are shown.
FIGURE 2
FIGURE 2
Adoptively transferred BMDCs were detected in the lymphoid organs and pancreatic tissue. BMDCs were pulsed with β cell Ag, labeled with CFSE, left uncoated or coated with control or anti-CTLA-4 Ab, and injected i.v. into pre-diabetic female NOD mice (5×10⁶ cell/mouse). One group of mice that did not receive DCs (non-recipient group) were used as background controls. Mice were euthanized after 24 h, single cell suspension of spleen, pancreatic LN and pancreata were examined for CD11c+CFSE+ cells by FACS. Representative scatter plots (gated for CD11c+ population) of three mice/group tested individually are shown. Percentage of CFSE+ population among CD11c+ cells is shown on each scatter plot.
FIGURE 3
FIGURE 3
DC directed CTLA-4 engagement in pre-diabetic NOD mice delays hyperglycemia. Eight-week (A) and 12-week (B) old euglycemic female NOD mice were left untreated or treated with β-cell Ag -pulsed or non-pulsed control or anti-CTLA-4 Ab coated DCs (5×10⁶ cells/mouse) twice 15-days apart. Mice were bled every week for up to 30 weeks of age to monitor blood glucose levels. Mice that showed glucose levels >250 mg/dl for two consecutive weeks were considered diabetic. Eight to 10 mice were included in each group, and the experiment was repeated with a similar number of mice/group. Values from each group were compared to that of untreated or Ag-pulsed control DC treated group using log-rank test and statistically significant values are shown. Statistically significant values obtained when Ag-pulsed anti-CTLA-4 Ab-DC recipient group was compared with untreated group (p=0.009 of panel A and p=0.013 of panel B) and Ag-pulsed control DC recipient group (p=0.021 of panel A and p=0.032 of panel B) are shown.
FIGURE 4
FIGURE 4
Treatment with Ag-pulsed anti-CTLA-4-Ab DCs suppresses insulitis in pre-diabetic mice. Eight week old euglycemic female NOD mice were left untreated or treated with β cell Ag pulsed control or anti-CTLA-4 Ab coated DCs as described for Fig. 3 and examined for insulitis 2 and 6 weeks after second injection with DCs. H&E-stained pancreatic sections were examined in a blinded fashion and the severity of lymphocyte infiltration was scored as described in materials and methods. Representative sections with different grades of insulitis are shown in the upper panel. Bar diagrams in the lower panel show the percentage of islets in each group with different grades of insulitis. One hundred islets from at least five mice were examined for each group.
FIGURE 5
FIGURE 5
DC directed CTLA-4 engagement induces suppressor cytokine producing hypo-proliferative T cells against β-cell Ag. Eight week old euglycemic female NOD mice were left untreated or treated with antigen-pulsed control or anti-CTLA-4 Ab coated DCs as described for Fig. 3. Cells from untreated (control) and DC recipient mice were examined ex vivo for antigen specific T cell response 15 days after second injection with DCs. A). Spleen and PnLN cells were incubated with β-cell Ag and the spent media collected from 72 h cultures were tested for IFN-γ, IL-4, IL-17, IL-10, and TGF-β1 by multiplex assay or ELISA. B) CFSE labeled spleen and PnLN cells were incubated with β cell Ag for 5 days, CFSE dilution in CD4+ population was examined by FACS after staining using fluorochrome-labeled CD4 specific Ab. Mean±SD values of cells from at least 5 mice tested in triplicate are shown for panels A and B. Representative scatter plots are also shown for panel B.
FIGURE 6
FIGURE 6
Treatment of NOD mice with Ag-pulsed anti-CTLA-4-Ab DCs results in the induction of Foxp3+ and IL-10+ T cells. Eight week old euglycemic female NOD mice were left untreated or treated with antigen-pulsed control or anti-CTLA-4 Ab coated DCs as described above for Fig. 3. On day 15 post-treatment, treated and untreated control mice were euthanized and freshly isolated spleen and pancreatic LN cells were stained for surface and intra-cellular markers using fluorochrome labeled Abs and analyzed by FACS. CD4+ population was gated for both panels. Representative scatter plots and percentage values for A) CD4+Foxp3+ and B) CD4+IL-10+ T cells (left panels) and mean±SD of the percentage values obtained using cells from at least 6 mice/group (right panels) are shown.
FIGURE 7
FIGURE 7
T cells from anti-CTLA-4 Ab DC treated mice delay diabetogenic T cell transfer induced hyperglycemia. A) Six week old NOD-Scid mice were left untreated (none) or i.v. injected with purified T cells from hyperglycemic wild-type NOD mice (diabetogenic T cells) (2×10⁶ cells/mouse) and β cell Ag pulsed control or anti-CTLA-4 Ab DC recipient mice (1×10⁶ cells/mouse) separately or in combination. B) In a separate experiment, NOD-Scid mice that received diabetogenic T cells (2×10⁶ cells/mouse) were also injected with purified CD4+CD25+ T cells from β cell Ag pulsed control or anti-CTLA-4- Ab DC treated mice (1×10⁶ cells/mouse). All T cell preparations were stimulated using anti-CD3 Ab (2 µg/ml) and anti-CD28 Ab (0.5 µg/ml) (2×10⁵/well cultured in round bottom pates) for 48 h before injection. Non-recipient and T cell recipient mice were tested for blood glucose levels every week. Mice that showed glucose levels >250 mg/dl for two consecutive bleeds were considered diabetic. Four mice were included in each group. Statistical significance was determined using log-rank test by comparing 1) anti-CTLA-4 Ab-DC T cell recipient group with control Ab-DC T cell recipient (p=0.0067 in panel A); 2) Diabetogenic T cells + Anti-CTLA-4 Ab DC T cell recipient group with diabetogenic T cells + Control Ab DC T cell recipient group (p=0.028 in panel A); 3) diabetogenic T cells + anti-CTLA-4 Ab DC CD4+CD25+ T cell recipient group with Diabetogenic T cells + control Ab DC CD4+CD25+ T cell recipient group (p=0.0072 in panel B).
FIGURE 8
FIGURE 8
DC directed enhanced engagement of CTLA-4 does not down-regulate CD28 expression, but promotes regulatory cytokine production leading to suppression of activated T cells. A) Non-pulsed or BDC peptide-pulsed DCs without (none), or with control or anti-CTLA-4 Ab coating were incubated with CFSE labeled purified CD4+ T cells from NOD.BDC2.5 TCR-Tg mice. Cells from these cultures were tested for CFSE dilution by FACS on day 4 after staining with PE-labeled anti-CD4 Ab. CD4+ T cells were gated for this panel. Representative histogram plots and percentage values of CD4+ T cells with CFSE dilution (left panel) and mean±SD of values from two independent assays carried out in triplicate (right panels) are shown. B) Supernatants collected from 72 h parallel cultures were tested for cytokines by ELISA. Mean±SD of values from three separate experiments carried out in triplicate are shown for panel B. C) Purified BDC2.5 T cells were cultured with BDC peptide-pulsed non-coated (control DCs) or Ab coated DCs for different durations, stained with fluorochrome labeled CD4, CD28, CTLA-4, CD69 specific Abs, and analyzed by FACS. The CD4+ population was gated for this panel. Each sub-panel shows a representative sample stained using an isotype control Ab and overlay of samples stained using Ab for a specified marker, and mean fluorescence intensity (MFI) value for each sample. The assay was repeated twice in triplicate with similar results.
FIGURE 9
FIGURE 9
TGF-β1 and IL-10 are the key players of DC directed enhanced CTLA-4 engagement mediated suppression of T cell proliferation and induction of Foxp3 and IL-10. A) BDC peptide-pulsed DCs that were coated with control or anti-CTLA-4 Ab and incubated with CFSE labeled purified CD4+ T cells from NOD.BDC2.5 TCR-Tg mice in the presence of isotype control Ab, or anti-IL-10 and/or anti-TGF-β1 Ab (5 µg individual Ab/ml). Cells from these cultures were tested for CFSE dilution by FACS on day 4 after staining with PE-labeled anti-CD4 Ab. CD4+ T cells were gated for this panel. Representative histogram plots and percentage values of CD4+ T cells with CFSE dilution from two independent assays carried out in triplicate are shown. B) Supernatants collected from 72 h parallel cultures were tested for cytokines by ELISA. Mean±SD of values from 2 separate experiments carried out in triplicate are shown for panel B. C) Unstained BDC2.5 T cells were cultured with Ab coated DCs and different Abs as described for panel A, stained for surface CD4 and CD25, and intracellular Foxp3 or IL-10 and analyzed by FACS. Cells tested for IL-10 were stimulated for 4 h using PMA and ionomycin in the presence of brefeldin A before staining. The CD4+ population was gated for the scatter plots shown and the percentages of Foxp3+ and IL-10+ populations are shown on each scatter plot. Representative scatter plots and percentage values from two independent assays carried out in triplicate are shown. Regions were set based on the background staining using flourchrome labeled isotype control Ab for panels A and C.
FIGURE 10
FIGURE 10
Exogenous IL-2 and TGF-β1 enhances DC directed CTLA-4 engagement mediated Foxp3+ Treg induction. Purified CD4+ T cells from BDC2.5 TCR-Tg mice were incubated with BDC peptide pulsed control or anti-CTLA-4 Ab coated DCs in the presence of recombinant IL-2 (10 U/ml) or TGF-β1 (1 ng/ml) for 4 days. A) Cells were stained using flurochrome labeled CD4, CD25, and Foxp3 specific Abs, and analyzed by FACS. In some assay wells, anti-TGF-β1 neutralizing Ab or isotype control Ab (5 µg/ml) was added. The CD4+ population was gated for the scatter plots shown here and the percentages of Foxp3+ population are shown on each scatter plot. B) After 96 h, cells that were cultured without or with exogenous IL-2 and TGF-β1 were stimulated for 4 h using PMA and ionomycin in the presence of brefeldin A, stained using flourochrome labeled anti-IL-10 Ab, and analyzed by FACS. The CD4+ population was gated for the scatter plots shown here and the percentages of IL-10+ population are shown on each scatter plot. Regions were set based on the background staining using flourchrome labeled isotype control Ab for both panel A and B. Representative scatter plots and percentage values of CD4+ T cells with Foxp3 or IL-10 expression (left sub-panels) and mean±SD of values (right sub-panels) from two independent assays carried out in triplicate are shown for both panel A and B. C) The T cells from parallel cultures were examined for surface levels of CTLA-4 by FACS. The CD4+ population was gated for the histograms. D) TGF-β1 levels in supernatants obtained from assay wells in which cells were cultured without rTGF-β1 and TGF-β1 neutralizing Ab were examined by ELISA. Mean±SD of values from two separate experiments carried out in triplicate are shown for this panel.
FIGURE 11
FIGURE 11
DC directed enhanced CTLA-4 engagement alters the function of diabetogenic T cells. A) Purified CD4+ T cells from BDC2.5 TCR-Tg mice were incubated with BDC peptide pulsed control or anti-CTLA-4 Ab coated DCs for 4 days. T cells from these cultures were injected i.v. into 4-week-old male NOD mice (1×10⁶/mouse; n=5/group), monitored for blood glucose levels, and the results are plotted as % diabetes free mice at different time-points. B) Pancreatic tissues obtained from an additional set of mice on day 5 post-T cell transfer were examined for insulitis as described under materials and methods. Representative sections with different grades of insulitis (left panel) and bar diagram showing the percentage of islets with different grades of insulitis in each group are shown (right panel). C and D) In parallel experiments, purified CD4+ T cells from BDC2.5 TCR-Tg mice were incubated with BDC peptide pulsed control or anti-CTLA-4 Ab coated DCs in the presence of recombinant IL-2 (10 U/ml) (panel C) or TGF-β1 (1 ng/ml) (panel D) for 4 days, T cells from these cultures were injected i.v. into male NOD mice (n=5/group) and monitored for blood glucose levels as described for panel A, and the results are plotted as % diabetes free mice at different time-points. Statistical significance of disease free status was assessed by log-rank test comparing control Ab coated DC group with anti-CTLA-4 Ab coated DC group.

Similar articles

Cited by

References

    1. Kukreja A, Cost G, Marker J, Zhang C, Sun Z, Lin-Su K, Ten S, Sanz M, Exley M, Wilson B, Porcelli S, Maclaren N. Multiple immuno-regulatory defects in type-1 diabetes. J Clin Invest. 2002;109:131–140. - PMC - PubMed
    1. Ueda H, Howson JM, Esposito L, Heward J, Snook H, Chamberlain G, Rainbow DB, Hunter KM, Smith AN, Di Genova G, et al. Association of the T-cell regulatory gene CTLA4 with susceptibility to autoimmune disease. Nature. 2003;423:506–511. - PubMed
    1. Gambelunghe G, Brozzetti A, Ghaderi M, Candeloro P, Tortoioli C, Falorni A. MICA gene polymorphism in the pathogenesis of type 1 diabetes. Ann N Y Acad Sci. 2007;1110:92–98. - PubMed
    1. Wicker LS, Clark J, Fraser HI, Garner VE, Gonzalez-Munoz A, Healy B, Howlett S, Hunter K, Rainbow D, Rosa RL, Smink LJ, Todd JA, Peterson LB. Type 1 diabetes genes and pathways shared by humans and NOD mice. J. Autoimmun. 2005;25 Suppl:29–33. - PubMed
    1. Tivol EA, Borriello F, Schweitzer AN, Lynch WP, Bluestone JA, Sharpe AH. Loss of CTLA-4 leads to massive lymphoproliferation and fatal multiorgan tissue destruction, revealing a critical negative regulatory role of CTLA-4. Immunity. 1995;3:541–547. - PubMed

Publication types

MeSH terms