. 2010 Jun 15;184(12):6709-18.
doi: 10.4049/jimmunol.0903612. Epub 2010 May 10.

Human tumor antigen-specific helper and regulatory T cells share common epitope specificity but exhibit distinct T cell repertoire

Affiliations

Human tumor antigen-specific helper and regulatory T cells share common epitope specificity but exhibit distinct T cell repertoire

Julien Fourcade et al. J Immunol. .

Abstract

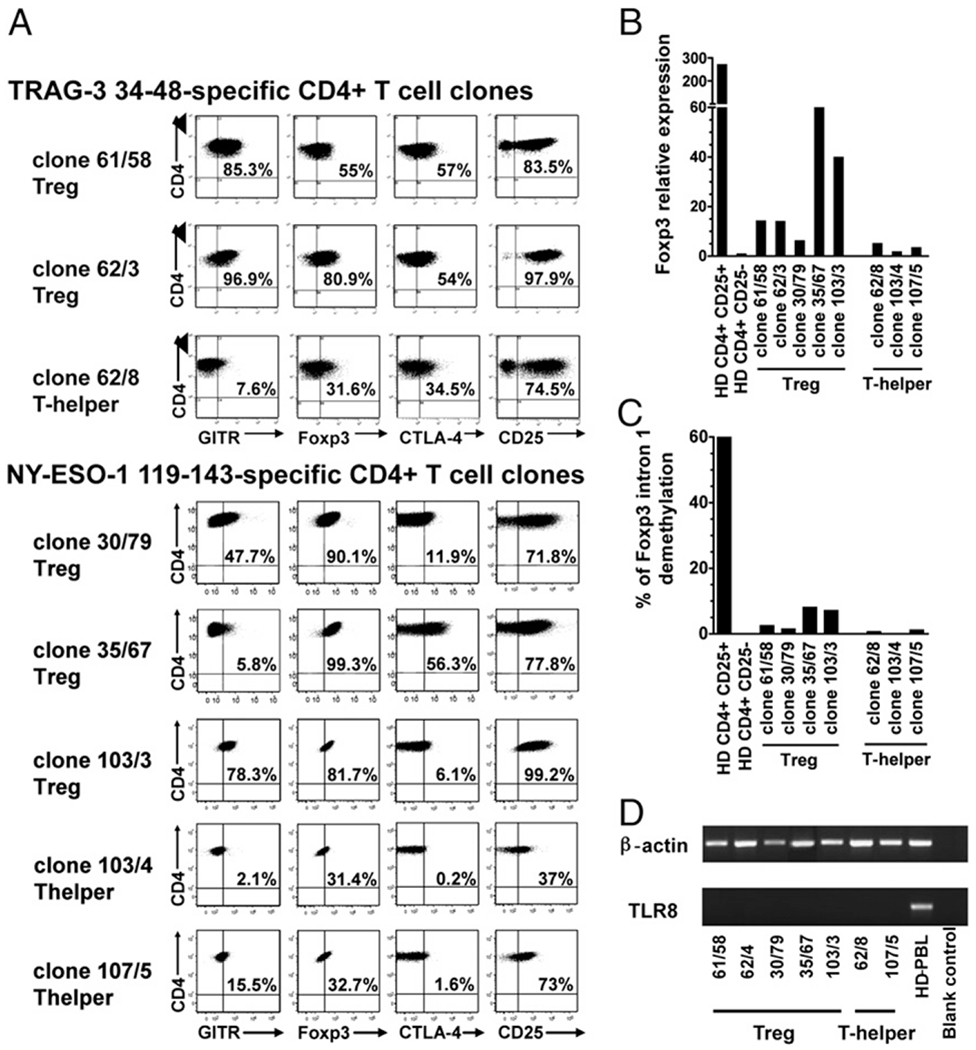
CD4(+) regulatory T cells (Tregs) accumulate at tumor sites and play a critical role in the suppression of immune responses against tumor cells. In this study, we show that two immunodominant epitopes derived from the tumor Ags (TAs) NY-ESO-1 and TRAG-3 stimulate both CD4+ Th cells and Tregs. TA-specific Tregs inhibit the proliferation of allogenic T cells, act in a cell-to-cell contact dependent fashion and require activation to suppress IL-2 secretion by T cells. TRAG-3 and NY-ESO-1-specific Tregs exhibit either a Th1-, a Th2-, or a Th0-type cytokine profile and dot not produce IL-10 or TGF-beta. The Foxp3 levels vary from one Treg clone to another and are significantly lower than those of CD4+CD25high Tregs. In contrast to NY-ESO-1-specific Th cells, the NY-ESO-1-specific and TRAG-3-specific Treg clonotypes share a common TCR CDR3 Vbeta usage with Foxp3+CD4+CD25high and CD4+CD25- T cells and were not detectable in PBLs of other melanoma patients and of healthy donors, suggesting that their recruitment occurs through the peripheral conversion of CD4+CD25- T cells upon chronic Ag exposure. Collectively, our findings demonstrate that the same epitopes spontaneously stimulate both Th cells and Tregs in patients with advanced melanoma. They also suggest that TA-specific Treg expansion may be better impaired by therapies aimed at depleting CD4+CD25high Tregs and preventing the peripheral conversion of CD4+CD25- T cells.


Conflict of interest statement

Disclosures

The authors have no financial conflicts of interest.

Figures

FIGURE 1.
FIGURE 1.
TRAG-3 34-48–specific and NY-ESO-1 119-143–specific CD4+ Treg clones inhibit the proliferation of responder T cells. The proliferation of allogenic CFSE-labeled naive CD45RA+ T cells obtained from blood of HDs was assessed after 5 d of stimulation with soluble anti-CD3 and IL-2 in the presence of autologous CD3-depleted APCs and TRAG-3– or NY-ESO-1–specific CD4+ T cell clones. Flow cytometry histograms are displayed for different ratios of responder CD4+ and CD8+ naive T cells to effector CD4+ T cell clones (R:E). Proliferation of naive T cells was inhibited by the presence of (A) TRAG-3 34-48–specific CD4+ T cell clones 61/58 (MP1) and 62/3 (HD1) and (B) NY-ESO-1 119-143–specific CD4+ T cell clones 30/79 and 35/67 (HD2). C, Opposite effect was observed with TRAG-3 34-48–specific CD4+ T cell clone 62/8 (HD1) and NY-ESO-1 119-143–specific CD4+ T cell clone 11/4 (MP3). Transwell experiments confirmed that cell–cell contact is required for inhibition of proliferation by Treg clones (A-C, right panels). One of three independent experiments is depicted.
FIGURE 2.
FIGURE 2.
NY-ESO-1–specific CD4+ Tregs are isolated ex vivo from PBLs of melanoma patients. A, CD4+ T cells isolated from PBLs of MP2 were incubated ex vivo for 6 h with autologous APCs pulsed with peptide NY-ESO-1 119-143 or peptide HIVpol 711-725 as negative control. CD4+ T cells were stained with an anti–IFN-γ–PE Ab or a PE-labeled IgG isotype control Ab. IFN-γ–positive NY-ESO-1–specific CD4+ T cells were sorted (one cell per well) and expanded in vitro in the absence of peptide. B, NY-ESO-1–specific CD4+ T cell clone 103/3 inhibited the proliferation of naive T cells. C, NY-ESO-1–specific CD4+ T cell clones 103/4 and 107/5 enhanced the proliferation of responder cells. One of three independent experiments performed is displayed.
FIGURE 3.
FIGURE 3.
TRAG-3 34-48–specific and NY-ESO-1 119-143–specific CD4+ Treg clones have low proliferative capacity. Proliferation of CFSE-labeled TRAG-3–specific CD4+ Treg clone 61/58 and NY-ESO-1–specific CD4+ Treg clones 30/79, 35/67, and 103/3 was assessed after 5 d of stimulation with soluble anti-CD3 Ab (0.1 μg/ml) and IL-2 (50 IU/ml) in the presence of allogenic CD3-depleted APCs obtained from PBLs of one HD. TRAG-3–specific CD4+ Treg clone 61/58 and NY-ESO-1–specific CD4+ Treg clones 30/79, 35/67, and 103/3 proliferated significantly less than TRAG-3–specific CD4+ Th clone 62/8, NY-ESO-1–specific CD4+ Th clones 11/4 and 103/4 as well as naive CD45RA+ T cells isolated from PBLs of one HD. One of three independent experiments is depicted. No Stim, no stimulation.
FIGURE 4.
FIGURE 4.
Phenotypic analysis of TRAG-3 34-48–specific and NY-ESO-1 119-143–specific CD4+ Tregs and Th clones. A, TRAG-3–specific CD4+ Treg clones 61/58 and 62/3 expressed high levels of GITR and Foxp3 compared with Th clone 62/8 (upper panel). Two of three NY-ESO-1–specific CD4+ Treg clones, clones 30/79 and 103/3, expressed high levels of GITR and all Treg clones expressed high levels of Foxp3, compared with Th clones 103/4 and 107/5 (lower panel). All Treg clones expressed high levels of CD25 and variable levels of CTLA-4. B, The relative expression of Foxp3 by TRAG-3–specific and NY-ESO-1–specific CD4+ T cell clones was estimated by real-time quantitative PCR and is displayed using the expression of Foxp3 by CD4+ CD25 T cells of one HD as base line (i.e., value of 1). C, The demethylation status of Foxp3 intron 1 from TRAG-3–specific and NY-ESO-1–specific CD4+ T cell clones was assessed by QRT-PCR. The results are expressed as percentages of unmethylated Foxp3 sequences and compared with CD4+CD25 and CD4+CD25+ T cells of one HD. D, The expression pattern of TLR-8 in TRAG-3–specific and NY-ESO-1–specific CD4+ T cell clones was determined by RT-PCR. β-actin was used as an internal control. PBLs obtained from one HD served as a positive control (HD-PBL). None of the analyzed TRAG-3 34-48–specific and NY-ESO-1 119-143–specific CD4+ T cell clones showed expression of TLR-8. One of three independent experiments is depicted.
FIGURE 5.
FIGURE 5.
TA-specific CD4+ Tregs produce either Th1-, Th2-, or Th0-type cytokines and suppress IL-2 production by responder T cells. A, TA-specific CD4+ Treg and Th clones were stimulated in vitro in the presence of cognate peptide-pulsed APCs prior to measuring cytokine production in supernatants after a 24-h incubation. TRAG-3–specific clone 61/58 secreted Th1-type cytokines. NY-ESO-1–specific CD4+ Treg clones 103/3 displayed a Th2-type cytokine profile; whereas, NY-ESO-1–specific CD4+ Treg clones 30/79 and 35/67 displayed a Th0-type cytokine-profile. NY-ESO-1–specific CD4+ Th clone 107/5 and TRAG-3–specific CD4+ Th clone 62/8 displayed a Th1-type and a Th0-type cytokine profile, respectively. They produced IL-2 and higher amounts of IFN-γ and TNF-α than TA-specific Treg clones. B and C, TRAG-3 34-48–specific CD4+ Treg clone 61/58 or NY-ESO-1 119-143–specific CD4+ Treg clone 103/3 were cocultured with CFSE-labeled or unstained MART-1 27-35–specific CD8+ T cell clone 4/43 or NY-ESO-1 119-143–specific CD4+ Th clone 11/4 for 24 h in the presence of APCs pulsed with relevant or irrelevant peptides to Tregs. APCs pulsed with relevant or irrelevant peptides to CD8+ or Th cells were added after 24 h incubation. Supernatants were collected and analyzed for IL-2 by ELISA after an additional 24 h incubation (B) or CFSE-labeled CD4+ Th or CD8+ T cell clones were stained intracellularly for IL-2 and analyzed by flow cytometry after an additional 6 h incubation (C). Upon cognate Ag activation, TRAG-3-specific CD4+ Treg clone 61/58 inhibited IL-2 production by CD8+ and CD4+ Th cell clones stimulated with relevant peptides, and NY-ESO-1-specific CD4+ Treg clone 103/3 inhibited IL-2 secretion by CD8+ T cell clones. The strategy for gating on CFSE-labeled clones 11/4 and 4/43 as well as on CD4+ Treg clones 61/58 and 103/3 is shown. As controls, Treg clones 61/58 and 103/3 did not produce IL-2 upon Ag specific-stimulation, and TRAG-3-specific Th clone 62/8 and NY-ESO-1–specific CD4+ Th clone 107/5 did not inhibit IL-2 production by clones 11/4 and 4/43, respectively, upon recognition of their cognate Ag (C). One of three independent experiments is depicted. The mean ± SD of IL-2 secretion is shown.
FIGURE 6.
FIGURE 6.
Inhibition of IL-2 production by TRAG-3 34-48–specific CD4+ Treg clone correlates with decreased proliferation of TA-specific Th clones. The proliferation of CFSE-labeled NY-ESO-1–specific CD4+ Th clone 11/4 was assessed after 5 d of incubation with TRAG-3–specific Treg clone 61/58 in the presence of cognate-peptide–pulsed APCs. TRAG-3 34-48–specific Treg clone 61/58 inhibited proliferation of NY-ESO-1 119-143–specific Th clone 11/4 upon recognition of its cognate Ag but not in the presence of the irrelevant peptide. As control, TRAG-3–specific Th clone 62/8 did not inhibit proliferation of clone 11/4 upon recognition of its cognate Ag. One of two independent experiments is depicted.
FIGURE 7.
FIGURE 7.
NY-ESO-1–specific and TRAG-3–specific Tregs but not Th cells are detected in both CD4+CD25high and CD4+CD25 fractions of PBLs isolated from patients with advanced melanoma. A, CD4+ T cells were isolated ex vivo from PBLs of MP1 and MP2. CD4+CD25high and CD4+CD25 fractions were sorted by flow cytometry prior to RNA extraction. B and C, The relative expression levels of the TCR CDR3β regions of NY-ESO-1-specifc CD4+ Treg clone 103/3, TRAG-3–specific Treg clone 61/58 and NY-ESO-1–specific Th clones 103/4 and 107/5 in total PBLs of four MPs and four HDs and in CD4+CD25high and CD4+ CD25 cells of MP2 or MP1 were evaluated with quantitative real-time RT-PCR and were correlated with different dilution ratios of each CD4+ T cell clone in PBLs from one HD as described in Materials and Methods. Detectable levels of NY-ESO-1–specific Treg clone 103/3 (from MP2) and TRAG-3–specific Treg clone 61/58 (from MP1) CDR3p gene expression were found only in MP2 PBLs and MP1 PBLs, respectively, and in both the CD4+CD25high and CD4+CD252 T cell compartments of MP2 and MP1, respectively (B). NY-ESO-1–specific Th clones, 103/4 and 107/5 (from MP2), were detectable only in the CD4+CD25 T cell compartment of MP2 (C). One of three independent experiments is depicted.

Similar articles

Cited by

References

    1. Boon T, Cerottini JC, Van den Eynde B, van der Bruggen P, and Van Pel A. 1994. Tumor antigens recognized by T lymphocytes. Annu. Rev. Immunol 12: 337–365. - PubMed
    1. Rosenberg SA, Sherry RM, Morton KE, Scharfman WJ, Yang JC, Topalian SL, Royal RE, Kammula U, Restifo NP, Hughes MS, et al. 2005. Tumor progression can occur despite the induction of very high levels of self/tumor antigen-specific CD8+ T cells in patients with melanoma. J. Immunol 175: 6169–6176. - PubMed
    1. Marincola FM, Jaffee EM, Hicklin DJ, and Ferrone S. 2000. Escape of human solid tumors from T-cell recognition: molecular mechanisms and functional significance. Adv. Immunol 74: 181–273. - PubMed
    1. Sakaguchi S 2004. Naturally arising CD4+ regulatory t cells for immunologic self-tolerance and negative control of immune responses. Annu. Rev. Immunol 22: 531–562. - PubMed
    1. Shevach EM 2002. CD4+ CD25+ suppressor T cells: more questions than answers. Nat. Rev. Immunol 2: 389–400. - PubMed

Publication types

MeSH terms