. 2010 Jun 15;184(12):7071-81.
doi: 10.4049/jimmunol.1000110. Epub 2010 May 17.

Phagocytosis and phagosome acidification are required for pathogen processing and MyD88-dependent responses to Staphylococcus aureus

Affiliations

Phagocytosis and phagosome acidification are required for pathogen processing and MyD88-dependent responses to Staphylococcus aureus

W K Eddie Ip et al. J Immunol. .

Abstract

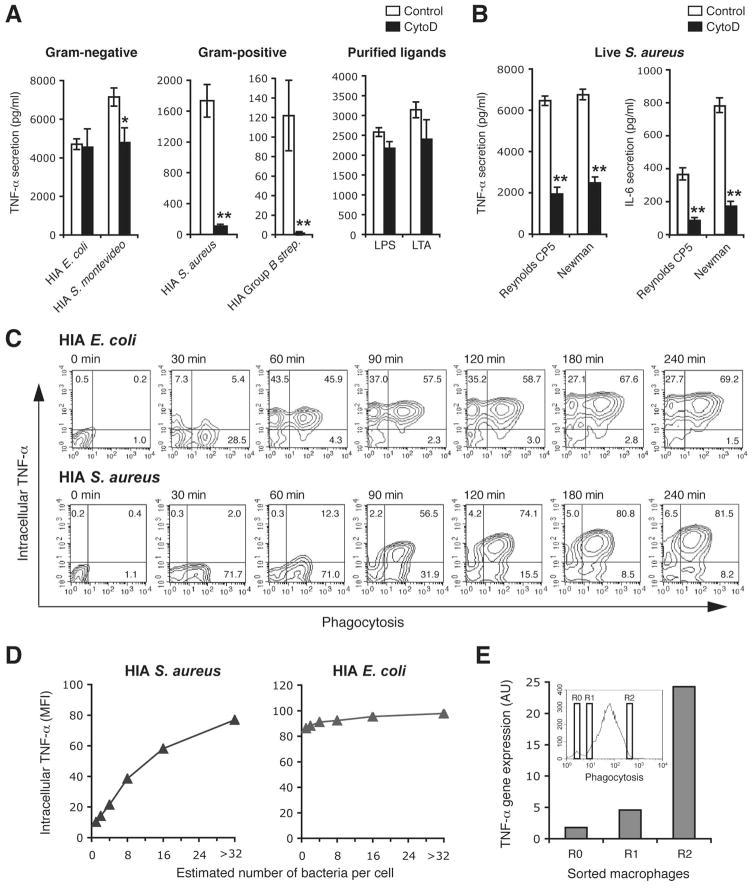
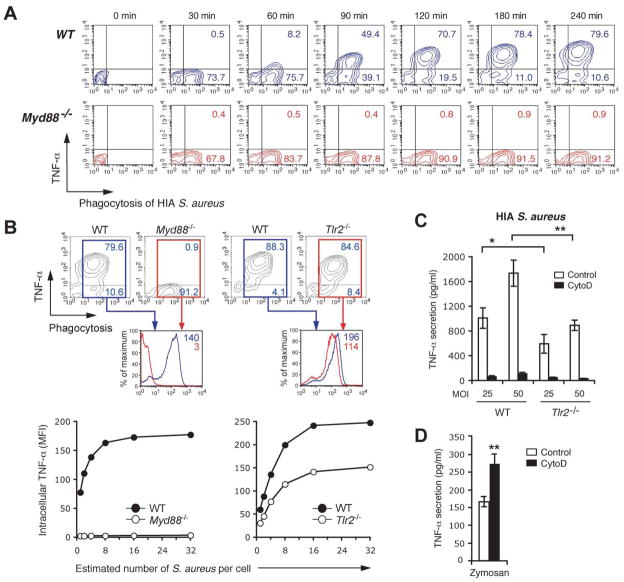
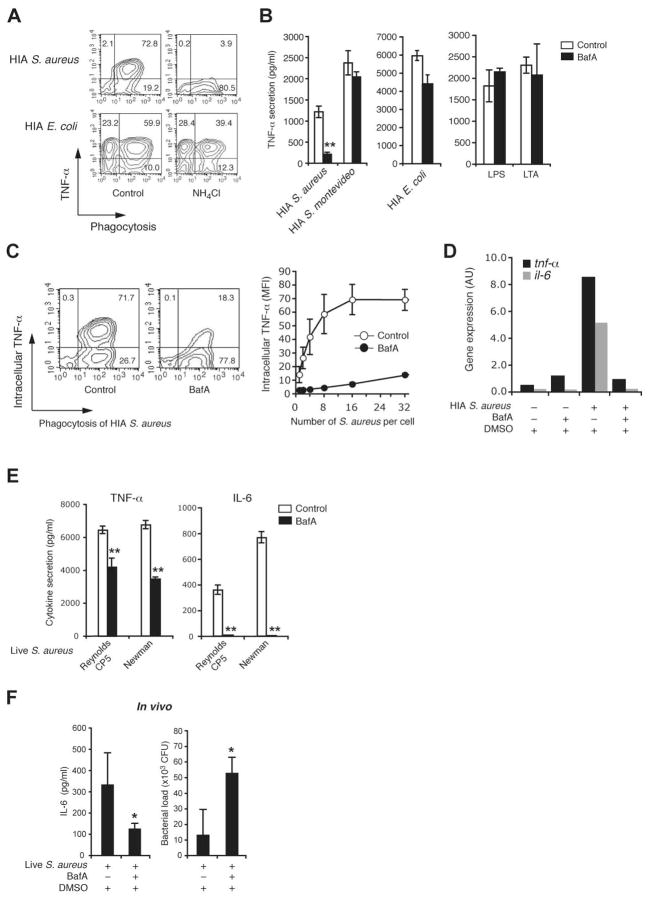
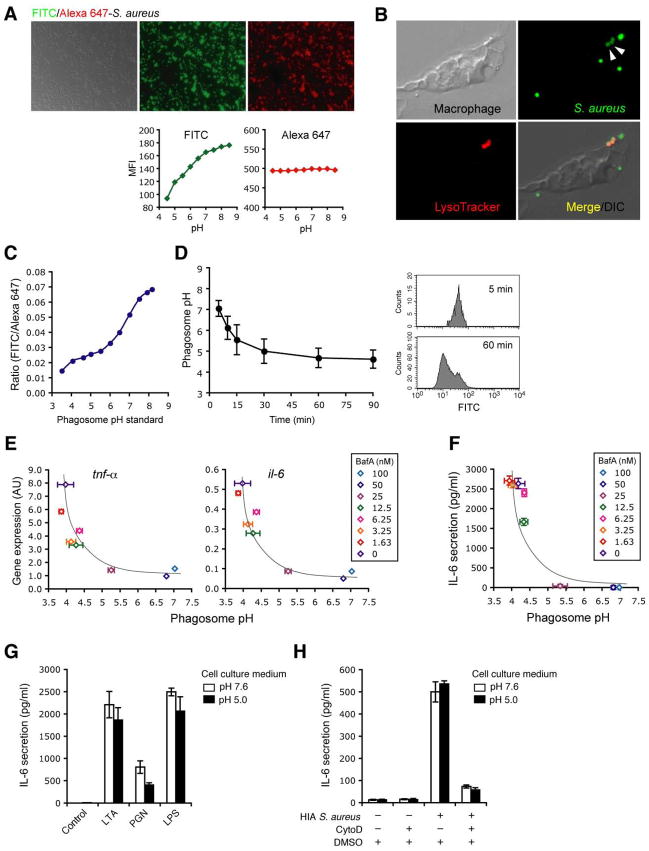
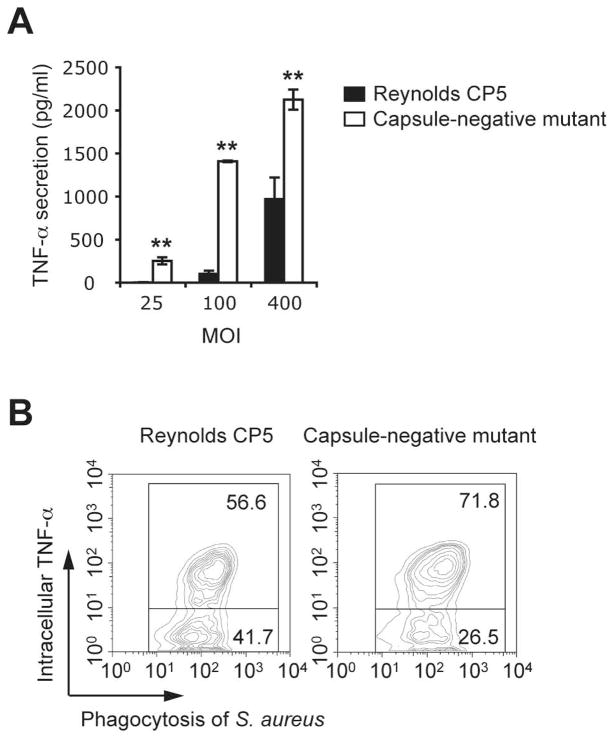
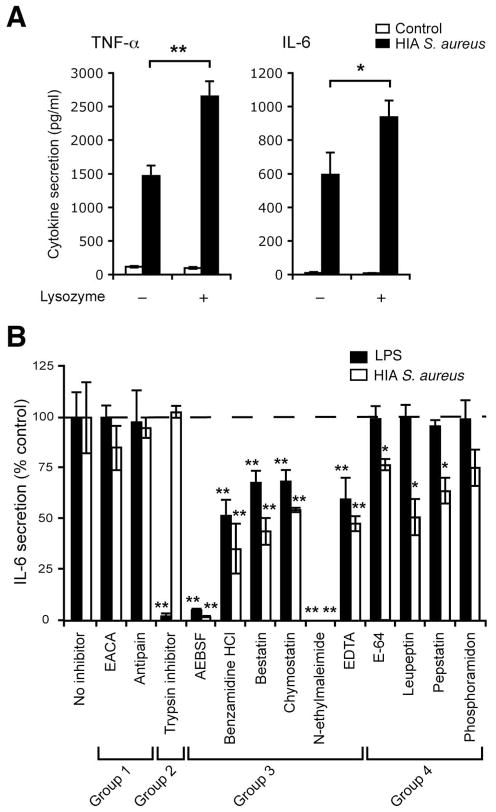
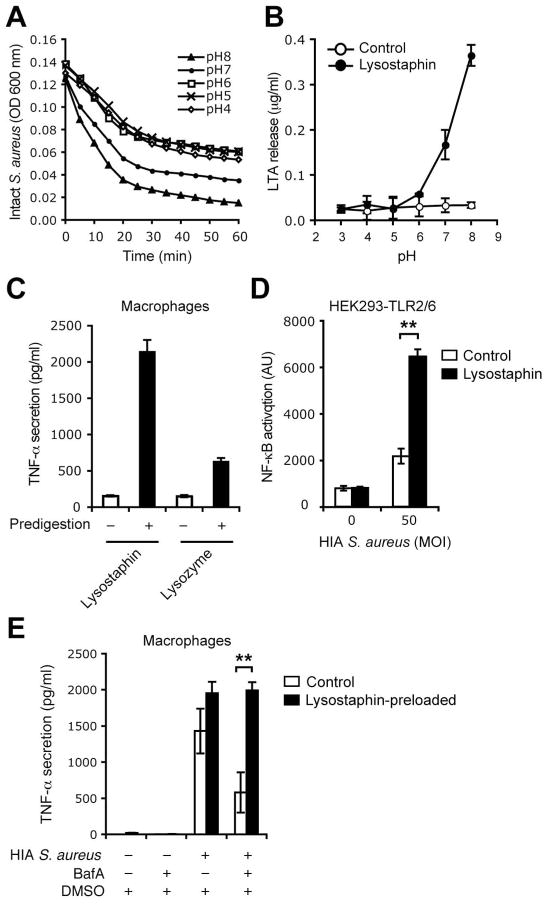
Innate immunity is vital for protection from microbes and is mediated by humoral effectors, such as cytokines, and cellular immune defenses, including phagocytic cells (e.g., macrophages). After internalization by phagocytes, microbes are delivered into a phagosome, a complex intracellular organelle with a well-established and important role in microbial killing. However, the role of this organelle in cytokine responses and microbial sensing is less well defined. In this study, we assess the role of the phagosome in innate immune sensing and demonstrate the critical interdependence of phagocytosis and pattern recognition receptor signaling during response to the Gram-positive bacteria Staphylococcus aureus. We show that phagocytosis is essential to initiate an optimal MyD88-dependent response to Staphylococcus aureus. Prior to TLR-dependent cytokine production, bacteria must be engulfed and delivered into acidic phagosomes where acid-activated host enzymes digest the internalized bacteria to liberate otherwise cryptic bacterial-derived ligands that initiate responses from the vacuole. Importantly, in macrophages in which phagosome acidification is perturbed, the impaired response to S. aureus can be rescued by the addition of lysostaphin, a bacterial endopeptidase active at neutral pH that can substitute for the acid-activated host enzymes. Together, these observations delineate the interdependence of phagocytosis with pattern recognition receptor signaling and suggest that therapeutics to augment functions and signaling from the vacuole may be useful strategies to increase host responses to S. aureus.


Figures

Figure 1
Figure 1. Bacterial internalization is required for macrophages cytokine response to S. aureus and Group B streptococcus but not E. coli or S. montevideo
A and B, TNF-α production by peritoneal macrophages pretreated with DMSO (control) or 6 μM cytochalasin D (CytoD) for 30 min to block internalization, and incubated with heat-inactivated (HIA) E. coli, S. montevideo, S. aureus (Reynolds CP5 strain) or Group B streptococcus at MOI 50, or bacterial ligand 10 ng/ml LPS or 2 μg/ml LTA (A), or exposed to live S. aureus strain Reynolds CP5 or Newman at MOI 10 (B). Induction of cytokine responses at 2 (TNF-α) or 4 (IL-6) h was measured by ELISA in culture supernatants. Data represents mean ± SD of triplicates. C, Single-cell analysis by FACS determining bacterial engulfment and intracellular TNF-α production. Peritoneal macrophages were pre-incubated with TAMRA-labeled HIA E. coli or HIA S. aureus at MOI 25 for 30 min at 4°C to synchronize phagocytosis and the further indicated time course at 37°C. Phagocytosis and intracellular TNF-α production was measured simultaneously by FACS. Contour plots show the percentages of TNF-α producing (top right quadrant) or -nonproducing (bottom right quadrant) cells that had phagocytosed bacteria, or TNF-α producing cells without bacterial internalization (top left quadrant). D, Correlation of intracellular TNF-α with the number of internalized bacteria in which the FACS analysis of the 120-min time point from (C) was used to estimate the number of internalized E. coli or S. aureus and to determine the correlation with intracellular TNF-α production (see Supplementary Figure S2). E, TNF-α gene expression in macrophages with low- or high-numbers of the phagosome containing S. aureus. Macrophages exposed to HIA S. aureus for 90 min were sorted into cells with no internalized bacteria (R0) and cells with either low (R1) or high numbers of internalized bacterial (R2) (as shown in the insert histogram). TNF-α gene expression in sorted cells was determined by quantitative PCR. Data represent TNF-α gene expression levels normalized to GAPDH. Data are representative of three (A and B) or two (C and D) independent experiments. *p ≤ 0.05; **p < 0.01.
Figure 2
Figure 2. The relative contributions of TLR2 and MyD88 to phagosome-dependent response to S. aureus
A and B, Phagocytosis and cytokine response in Myd88- or Tlr2-deficient macrophages. Peritoneal macrophages from wild-type (WT), Myd88−/− or Tlr2−/− mice in C57BL6 background were pre-incubated with TAMRA-labeled HIA S. aureus at MOI 25 for 30 min at 4°C, and incubated for the further indicated time course (A) or 4 h (B) at 37°C. Phagocytosis and intracellular TNF-α was measured simultaneously by FACS. Contour plots show the percentages of TNF-α-producing (top right quadrant) or TNF-α-non-producing cells (bottom right quadrant) after internalization of the bacteria. Lower histograms in (B) indicate the TNF-α production in macrophages of different genotypes that had engulfed bacteria in the different genotypes (WT in blue; Myd88−/− or Tlr2−/− in red). The number of internalized S. aureus in the macrophages was also estimated and correlated with intracellular TNF-α production as in Figure 1D (B, lower panels). C and D, The requirement for internalization on TLR2-dependent and TLR2-independent responses to S. aureus. Peritoneal macrophages from WT (C and D) or Tlr2−/− mice (C) were pretreated with DMSO (control) or 6 μM CytoD, and incubated with HIA S. aureus at MOI 50 (C) or zymosan (100 μg/ml) (D). TNF-α production at 2 h was measured by ELISA in culture supernatants. Data represent mean ± SD of triplicates. Data are representative of two (A and B) or three (C and D) independent experiments. *p ≤ 0.05; **p < 0.01.
Figure 3
Figure 3. Phagosome acidification is required for response to S. aureus
A, Effect of neutralizing the phagosome pH on cytokine response to E. coli and S. aureus. Peritoneal macrophages were pretreated without (control) or with NH4Cl (40 mM) for 30 min and incubated with TAMRA-labeled HIA E. coli or S. aureus at MOI 25 for 30 min at 4°C and the further 2 h at 37°C. Phagocytosis and intracellular TNF-α production was assessed simultaneously FACS as in Figure 1D. B–E, Impaired cytokine response to S. aureus in the absence of phagosome acidification. Peritoneal macrophages were pretreated with DMSO (control) or 50 nM bafilomycin A (BafA) for 60 min, and incubated with HIA S. aureus (Reynolds CP5 strain), E. coli or S. montevideo at MOI 50 (B and D), or TAMRA-labeled HIA S. aureus at MOI 25 (C), or live S. aureus strain Reynolds CP5 or Newman at MOI 10 (E). Alternatively cells were stimulated with purified bacterial ligands 10 ng/ml LPS or 2 μg/ml LTA (B). Induction of cytokine responses (B and E) at 2 (TNF-α) or 4 (IL-6) h was measured by ELISA in culture supernatants. Data represents mean ± SD of triplicates. Phagocytosis and intracellular TNF-α production (C, left panel) was assessed as in A, and the number of internalized S. aureus in the macrophages was also estimated and correlated with intracellular TNF-α production (C, right panel) as in Figure 1D. TNF-α and IL-6 gene expression at 3 h (D) was determined by quantitative PCR and normalized to GAPDH gene expression. F, Cytokine production (4 h) and bacterial load (24 h) were determined after in vivo S. aureus infection of mice in which phagosome acidification was blocked with i.p. BafA as described in Materials and Methods. Data are representative of three independent experiments. *p ≤ 0.05; **p < 0.01.
Figure 4
Figure 4. Phagosome acidification is required, but is not sufficient, for response to S. aureus
A-D, S. aureus ratiometric assay to determine phagosome pH. HIA S. aureus was labeled with FITC (pH-sensitive) and Alexa 647 (pH-insensitive) (A, upper panels). Quantification of FITC (green) and Alexa 647 (red) fluorescence intensity of the dual labeled bacteria incubated for 1–2 min in a series of known pH buffers was assessed by FACS to confirm pH sensitivity of the dyes (A, lower panels). pH sensitivity of FITC was also confirmed within acidic compartment in macrophages. After 30 min, FITC-labeled S. aureus were internalized into acidic compartments by macrophages preloaded with acidophilic LysoTracker (red). The FITC signal from these compartments (B, arrow heads) was significantly reduced as compared with those non-internalized or surface bound FITC-labeled S. aureus. Phagosome pH standard curves (C) were obtained as described in Materials and Methods. Kinetics of phagosome pH (D, left panel) was measured in peritoneal macrophages using the dual label S. aureus ratiometric assay, and examples of phagosome FITC signals from the cells at 5 and 60 min was shown in the histograms (D, right panels). E and F, Cytokine response in macrophages with arrested phagosome pH. Peritoneal macrophages pretreated with BafA at the indicated concentrations were incubated with the dual labeled S. aureus at low MOI (≤10). After 30 min at 4°C to synchronize uptake, macrophages were incubated for further 90 min (E) or 6 h (F) at 37°C and phagosome pH were determined. Cytokine gene expression in the cells (E) and IL-6 secretion in the supernatants (F) were measured by quantitative PCR and ELISA respectively, and correlated with the phagosome pH. G and H, Low pH is insufficient to rescue the impaired cytokine response to S. aureus in the absence of phagocytosis. Peritoneal macrophages in a neutral or acidic extracellular pH were stimulated with bacterial ligand 2 μg/ml LTA, 10 μg/ml PGN or 10 ng/ml LPS (G). Peritoneal macrophages pretreated with DMSO (control) or CytoD as in Figure 1A were stimulated with HIA S. aureus at MOI 50 in a neutral or acidic extracellular pH (H). IL-6 secretion was measure by ELISA in culture supernatants at 4h. Data indicate mean ± SD of triplicates. Data are representative of three independent experiments.
Figure 5
Figure 5. The S. aureus capsule limits access of PRRs to their agonistic ligands in the bacterial cell wall and cytokine response
A, HIA encapsulated (Reynolds CP5) or unencapsulated (capsule-negative mutant) S. aureus were incubated with peritoneal macrophages at the indicated MOIs. TNF-α secretion at 2 h was measured by ELISA in culture supernatants. Data represent mean ± SD of triplicates. B, Phagocytosis and intracellular TNF-α were measured simultaneously in macrophages incubated with TAMRA-labelled HIA Reynold CP5 or capsule-negative mutant. Contour plots show the percentages of TNF-α-producing (top right quadrant) or TNF-α-non-producing cells (bottom right quadrant) after internalization of the bacteria Data are representative of three independent experiments. *p ≤ 0.05; **p < 0.01.
Figure 6
Figure 6. pH-regulated host enzymes digest bacteria in the phagosome and are required for maximal induction of cytokine response to S. aureus
A, Lysozyme enhances the induction of cytokine response by S. aureus. Peritoneal macrophages preloaded with or without 15 μg/ml lysozyme for 15 min were incubated without (control) or with HIA S. aureus at MOI 50. Induction of cytokine responses at 2 h (TNF-α) or 4 h (IL-6) was measured by ELISA in culture supernatants. B, Effect of protease inhibitors on LPS or S. aureus induced IL-6 secretion. Peritoneal macrophages preloaded with the indicated inhibitor were stimulated with 50 ng/ml LPS or S. aureus at MOI of 50 for 4 h. IL-6 secretion was measured by ELISA of the culture supernatants. Data indicate mean ± SD of triplicates, and are shown as percentages of IL-6 secretion in (B) as compared with the response by control macrophages (no inhibitor). Group 1: no effect; Group 2: blocked LPS only; Group 3: blocked non-specifically (i.e. LPS and S. aureus); Group 4: blocked S. aureus only. Data are representative of three (A) or two (B) independent experiments. Statistical difference in the IL-6 response between no inhibitor and the indicated inhibitor treatments in (B) was indicated. *p ≤ 0.05; **p < 0.01.
Figure 7
Figure 7. Lysostaphin-mediated digestion of S. aureus rescues cytokine responses in the absence of phagosome acidification
A and B, Lysostaphin efficiently digests S. aureus at neutral pH. HIA S. aureus were incubated without (control) or with 5 μg/ml lysostaphin at the indicated pH. The digestion of the bacteria was assessed by measuring optical density (OD) of the bacterial suspensions at 600 nm over 60 min (A), and LTA release was measured by ELISA in the bacteria-free filtered supernatant at 2 h (B). C, Cryptic ligands released from lysostaphin- or lysozyme-treated S. aureus induce TNF-α response. HIA S. aureus were incubated in PBS (pH 7.5) without (−) or with (+) 5 μg/ml lysostaphin, or in potassium phosphate buffer (pH 6.0) without (−) or with (+) 5 μg/ml lysozyme, for 2 h. Soluble digests (filtered bacteria-free supernatants) were used to stimulate peritoneal macrophages and TNF-α secretion at 4 h was measured by ELISA of culture supernatant. D, Lysostaphin-mediated digestion of S. aureus increases immunostimulatory capacity of S. aureus by release of TLR2/6 ligands. HEK 293 cells stably expressing TLR2, co-transfected with NF-| B reporter system and TLR6, were incubated with heat-inactivated S. aureus in the absence (control) or presence of 15 μg/ml lysostaphin. Reporter gene activity at 4 h was measured by a luciferase assay. E, Preloading of lysostaphin in macrophages rescues cytokine response to S. aureus in the absence of phagosome acidification. Peritoneal macrophages pretreated with BafA were preloaded with 15 μg/ml lysostaphin for 15 min and incubated with HIA S. aureus. TNF-α secretion at 2 h was measured as in (C). Data are representative of three independent experiments.

References

    1. Aderem A, Underhill DM. Mechanisms of phagocytosis in macrophages. Annu Rev Immunol. 1999;17:593–623. - PubMed
    1. Greenberg S, Grinstein S. Phagocytosis and innate immunity. Curr Opin Immunol. 2002;14:1366–145. - PubMed
    1. Stuart LM, Ezekowitz RA. Phagocytosis: elegant complexity. Immunity. 2005;22:539–550. - PubMed
    1. Desjardins M, Huber LA, Parton RG, Griffiths G. Biogenesis of phagolysosomes proceeds through a sequential series of interactions with the endocytic apparatus. J Cell Biol. 1994;124:677–688. - PMC - PubMed
    1. Garin J, Diez R, Kieffer S, Dermine JF, Duclos S, Gagnon E, Sadoul R, Rondeau C, Desjardins M. The phagosome proteome: insight into phagosome functions. J Cell Biol. 2001;152:165–180. - PMC - PubMed

Publication types

MeSH terms

Substances