. 2010 Oct;38(18):6007-17.
doi: 10.1093/nar/gkq397. Epub 2010 May 18.

Genome-wide interrogation of hepatic FXR reveals an asymmetric IR-1 motif and synergy with LRH-1

Affiliations

Genome-wide interrogation of hepatic FXR reveals an asymmetric IR-1 motif and synergy with LRH-1

Hansook Kim Chong et al. Nucleic Acids Res. 2010 Oct.

Abstract

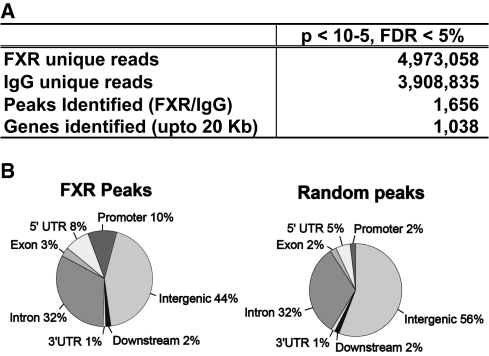
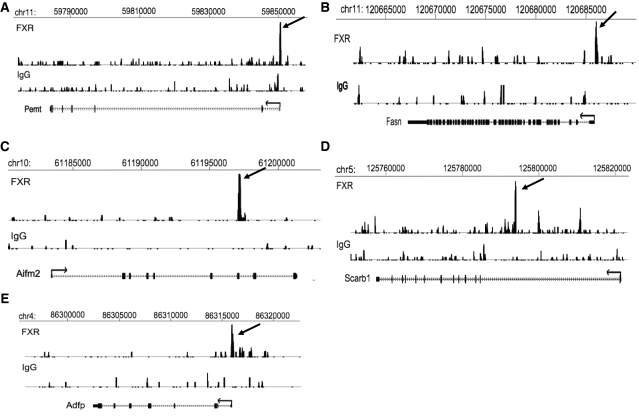
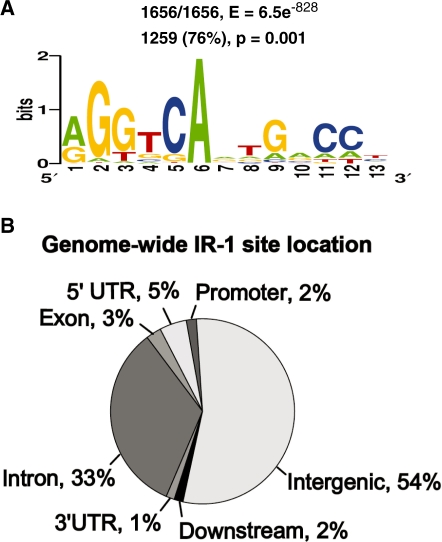
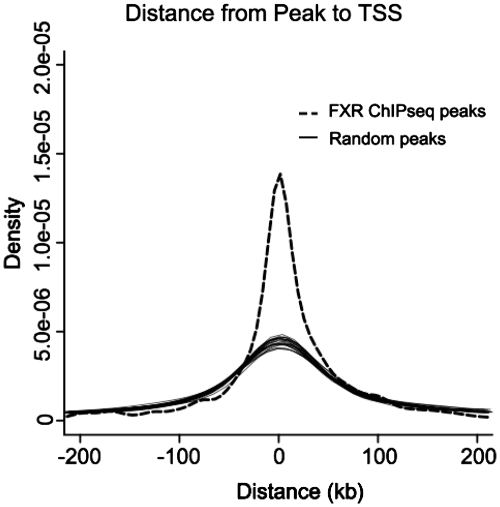
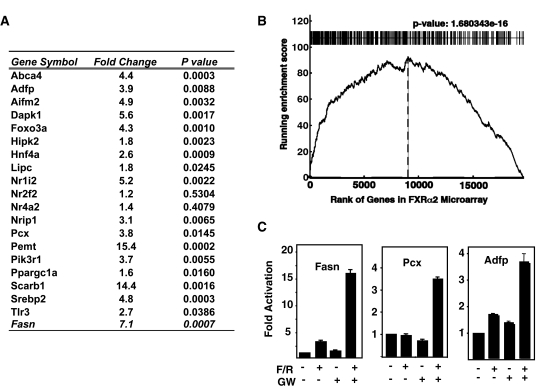
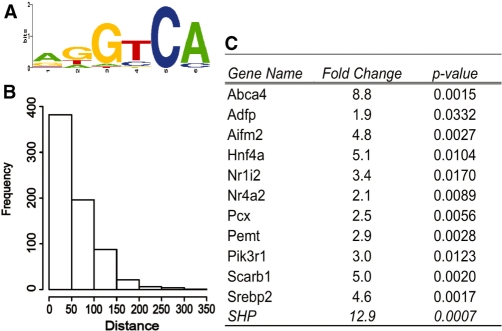
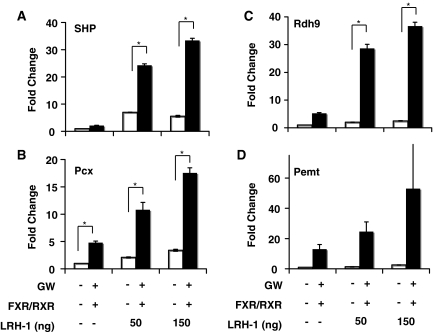
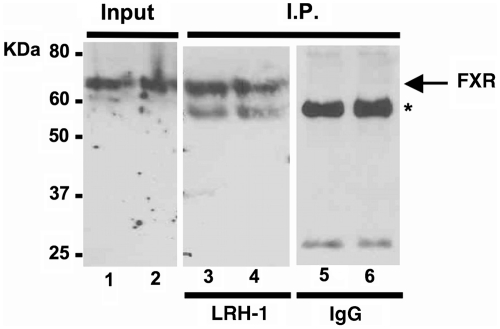
We used mouse hepatic chromatin enriched with an FXR antibody and chromatin immunoprecipitation-sequencing (ChIP-seq) to evaluate FXR binding on a genome-wide scale. This identified 1656 FXR-binding sites and 10% were located within 2 kb of a transcription start site which is much higher than predicted by random occurrence. A motif search uncovered a canonical nuclear receptor IR-1 site, consistent with in vitro DNA-binding studies reported previously. A separate nuclear receptor half-site for monomeric receptors such as LRH-1 was co-enriched and FXR activation of four newly identified promoters was significantly augmented by an LRH-1 expression vector in a co-transfection assay. There were 1038 genes located within 20 kb of a peak and a gene set enrichment analysis showed that genes identified by our ChIP-seq analysis are highly correlated with genes activated by an FXR-VP16 adenovirus in primary mouse hepatocytes providing functional relevance to the genome-wide binding study. Gene Ontology analysis showed FXR-binding sites close to many genes in lipid, fatty acid and steroid metabolism. Other broad gene clusters related to metabolism, transport, signaling and glycolysis were also significantly enriched. Thus, FXR may have a much wider role in cellular metabolism than previously appreciated.


Figures

Figure 1.
Figure 1.
ChIP-seq analysis for FXR binding to DNA in hepatic chromatin. (A) Summary of ChIP-seq analysis by MACS. Given mfold 10 and sonication size (bw) 300 bp, MACS searched 2bw window area across the genome to find genomic peaks with tags more than mfold enriched relative to a random tag genome distribution. The results were obtained using the parameters of P-value cutoff 1×10⁻⁵ and FDR 5%. (B) Mapping of FXR-binding regions on genome-wide scale relative to RefSeq mouse genes. The ‘promoter’ and ‘downstream’ are defined as 2 kb of 5′ or 3′ flanking regions. Intergenic region refers to all locations other than ‘promoter’, ‘5′ UTR’, ‘exon’, ‘intron’, ‘3′UTR’ or ‘downstream’.
Figure 2.
Figure 2.
Representative view of a ChIP-seq peak. The novel FXR binding sites, mapped onto University of California at Santa Cruz (UCSC) genome browser, were identified in several genes presented here. Shown are chromosomal locations according to the July 2007 Mouse Genome Assembly (mm9). Gene associated peaks are noted by the arrows. (A) Pemt (phosphatidylethanolamine N-methyltransferase). (B) Fasn (fatty acid synthase). (C) Aifm2 (apoptosis-inducing factor 2, mitochondrian). (D) Scarb1 (scavenger receptor B-1). (E) Adfp (adipose differentiation related protein).
Figure 3.
Figure 3.
Motif analysis. (A) Consensus FXR-binding motif Weblogo found within the peaks identified by ChIP-seq using MEME program. The IR-1 motif was found in 76% of the FXR-binding sites when PWM from MEME analysis was used. (B) Genome-wide location of IR-1 sites around mouse genome. Its PWM was obtained by using MEME.
Figure 4.
Figure 4.
Distance from the center of each peak identified as FXR-binding site to the transcription start site (TSS) of the nearest gene. The TSSs were taken from NCBI RefSeq database. Each black line represents a separate set of random sequences of similar length.
Figure 5.
Figure 5.
Peak validation. (A) Manual ChIP confirmation for ChIPed liver DNA by qPCR. Nineteen FXR-binding peaks were randomly selected for validation by gene-specific ChIP qPCR. Fold Change is the fold increase for the signal from DNA enriched by FXR antibody relative to a control IgG. Fasn was used as a positive control. Data were normalized to the housekeeping gene L32. (B) KS plot. The gene list for the ChIP-seq peaks that were located within 20 kb of a known gene was compared for their correlation to a set of genes that were activated by infection of primary mouse hepatocytes with a recombinant adenovirus expressing the constitutive FXRα2-VP16 hybrid protein as described in the text. Genes in the expression microarray were ranked by fold difference (x-axis) and the graph plots the running enrichment score. (C) Promoter activation assay. Luciferase reporter plasmids with promoters from genes from our ChIP-seq dataset were constructed. Pcx (pyruvate carboxylase) and Adfp (adipose differentiation-related protein) were previously unknown to be FXR target genes, and contained putative FXR-binding sites in their proximal promoters and tested for FXR activation by transient transfection. Expression of the reporters was stimulated by GW4064 treatment in cells co-transfected with FXR and RXR expression vectors. Fasn (fatty acid synthase) was used as a positive control.
Figure 6.
Figure 6.
Co-regulator analysis. (A) Co-regulatory DNA-binding motif identified along with FXR-binding motif. The IR-1 elements in each FXR peak were masked and then FXR-binding peaks were searched for motifs located within 150 bp on either side of each peak. (B) Distance from the best IR-1 site to midpoint of closest additional NR half site. (C) qPCR analysis of 12 peaks for LRH-1 binding. Results are presented as fold change from control as in Supplementary Figure 1.
Figure 7.
Figure 7.
Co-transfection assay for FXR-LRH-1 activation. 293T cells were transfected with luciferase reporter plasmids indicated with or without expression vectors pCMX-FXR2 (100 ng/well), pCMX-RXR (100 ng/well), and LRH-1. After 6 hr of transfection, cells were treated with DMSO or synthetic FXR agonist GW4064 as indicated and cells were harvested after 24 h. Luciferase and -gal assays were then performed on cell extracts. The data are representative of at least three experiments. In the experiment shown, SHP, Pcx, and Rdh9 were analyzed in triplicate and * indicates p < 0.05. In this experiment, Pemt was analyzed in duplicate only. (A) SHP (small heterodimer partner). (B) Pcx (pyruvate carboxylase). (C) Rdh9 (retinol dehydrogenase 9). (D) Pemt (phosphatidylethanolamine N-methyltransferase).
Figure 8.
Figure 8.
FXR and LRH-1 proteins interact with each other. Hepatic chromatin was subjected to immunoprecipitation with a LRH-1 antibody (lanes 3 and 4) or control IgG (lanes 5 and 6) and the precipitated material was analyzed by immunoblotting with an antibody to FXR. Duplicate samples were analyzed and the positions for FXR in the starting material is also shown. Input is shown in lanes 1 and 2. The asterisk marks the migration of the IgG heavy chain.

References

    1. Lefebvre P, Cariou B, Lien F, Kuipers F, Staels B. Role of bile acids and bile acid receptors in metabolic regulation. Physiol. Rev. 2009;89:147–191. - PubMed
    1. Russell DW. The enzymes, regulation, and genetics of bile acid synthesis. Annu. Rev. Biochem. 2003;72:137–174. - PubMed
    1. Zhang Y, Edwards PA. FXR signaling in metabolic disease. FEBS Lett. 2008;582:10–18. - PubMed
    1. Claudel T, Staels B, Kuipers F. The Farnesoid X receptor: a molecular link between bile acid and lipid and glucose metabolism. Arterioscler. Thromb. Vasc. Biol. 2005;25:2020–2030. - PubMed
    1. Ma K, Saha PK, Chan L, Moore DD. Farnesoid X receptor is essential for normal glucose homeostasis. J. Clin. Invest. 2006;116:1102–1109. - PMC - PubMed

Publication types

Substances