. 2010 May;22(5):1575-91.
doi: 10.1105/tpc.109.070680. Epub 2010 May 18.

The RNA binding protein Tudor-SN is essential for stress tolerance and stabilizes levels of stress-responsive mRNAs encoding secreted proteins in Arabidopsis

Affiliations

The RNA binding protein Tudor-SN is essential for stress tolerance and stabilizes levels of stress-responsive mRNAs encoding secreted proteins in Arabidopsis

Nicolas Frei dit Frey et al. Plant Cell. 2010 May.

Abstract

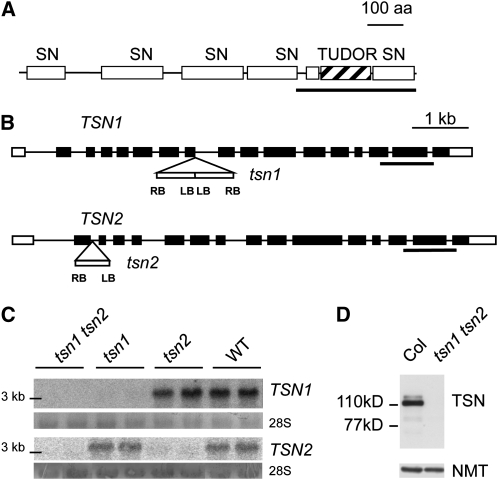
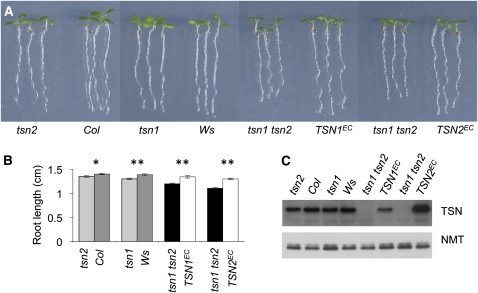
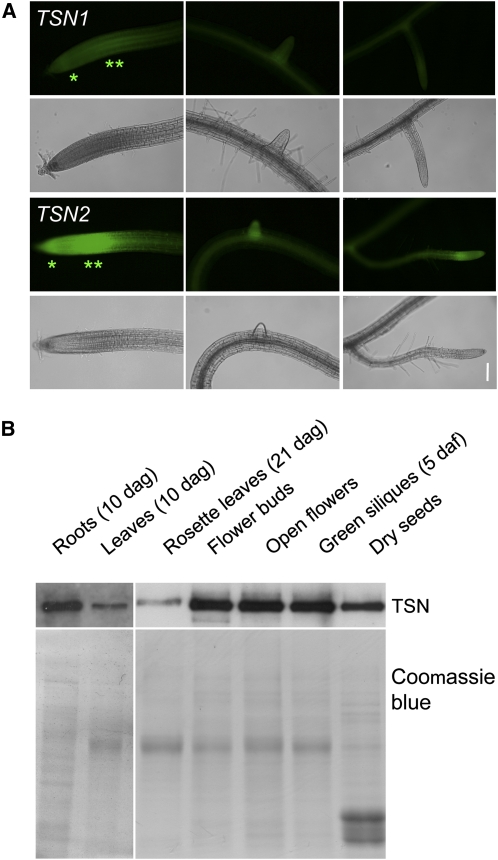
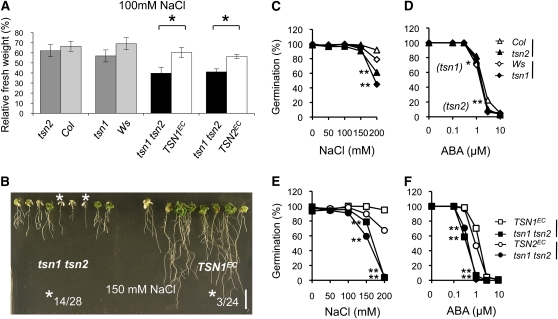
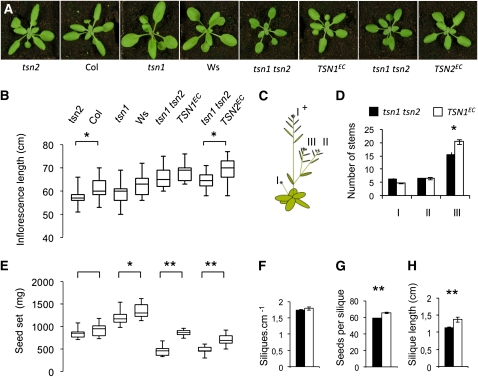
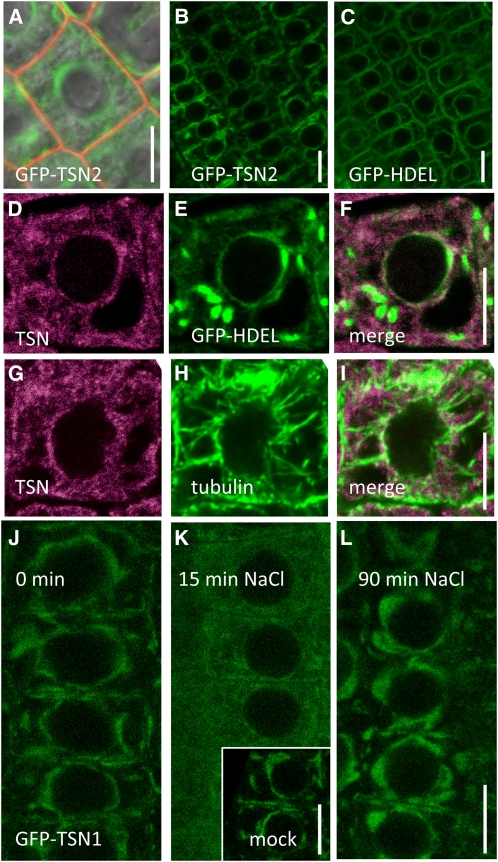
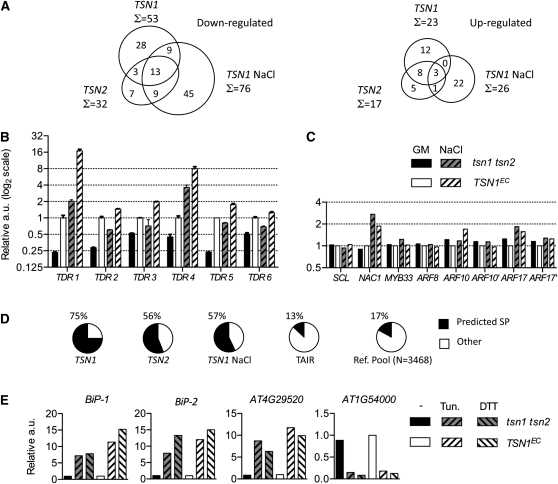
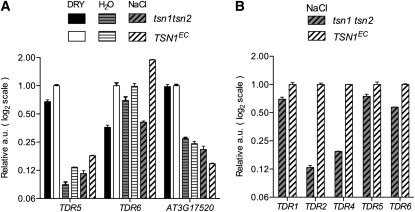
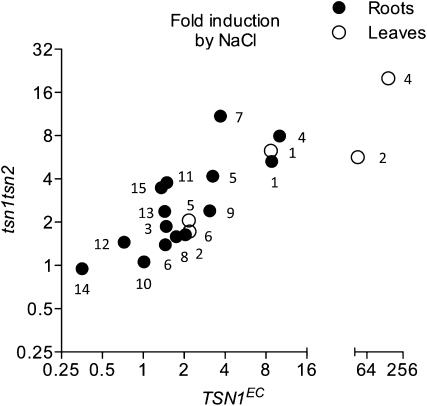
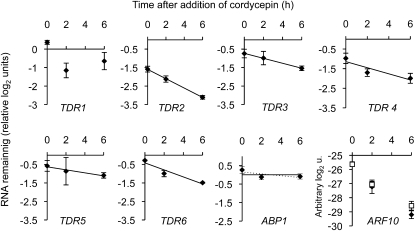
Tudor-SN (TSN) copurifies with the RNA-induced silencing complex in animal cells where, among other functions, it is thought to act on mRNA stability via the degradation of specific dsRNA templates. In plants, TSN has been identified biochemically as a cytoskeleton-associated RNA binding activity. In eukaryotes, it has recently been identified as a conserved primary target of programmed cell death-associated proteolysis. We have investigated the physiological role of TSN by isolating null mutations for two homologous genes in Arabidopsis thaliana. The double mutant tsn1 tsn2 displays only mild growth phenotypes under nonstress conditions, but germination, growth, and survival are severely affected under high salinity stress. Either TSN1 or TSN2 alone can complement the double mutant, indicating their functional redundancy. TSN accumulates heterogeneously in the cytosol and relocates transiently to a diffuse pattern in response to salt stress. Unexpectedly, stress-regulated mRNAs encoding secreted proteins are significantly enriched among the transcripts that are underrepresented in tsn1 tsn2. Our data also reveal that TSN is important for RNA stability of its targets. These findings show that TSN is essential for stress tolerance in plants and implicate TSN in new, potentially conserved mechanisms acting on mRNAs entering the secretory pathway.


Figures

Figure 1.
Figure 1.
Reverse Genetics of Arabidopsis TSN Genes. (A) Domain architecture of TSN proteins. The schematic shows the SN domains and the tudor domain, which is interdigitated with the fifth SN domain. The fragment produced in Escherichia coli for the generation of TSN antibodies is underlined. aa, amino acids. (B) Intron-exon structure of TSN1 and TSN2. The position and structure of T-DNA insertions in the tsn1 and tsn2 alleles are indicated (not to scale; details in Methods). White boxes, untranslated regions; black boxes, exons. LB and RB, left border and right border of the T-DNA. (C) Blots of seedling RNA. Genotypes, products from the tsn2 × tsn1 cross are indicated at the top (two lines per genotype are shown). Probes employed, indicated at the right, correspond to regions underlined in (B). Note the absence of signal in tsn1 tsn2. The 28S rRNA band is shown below each hybridization as a control. WT, wild type. (D) Protein blot of seedling extracts. Genotypes are indicated at the top, and antibodies employed are on the right. Note the absence of signal in tsn1 tsn2. Positions of two molecular weight markers are indicated on the left. Detection of N-myristoyltransferase (NMT) serves as a control.
Figure 2.
Figure 2.
Root Growth of tsn1, tsn2, and tsn1 tsn2 Mutants. (A) Picture of representative 5-d-old seedlings. In this and following figures, tsn1 and tsn2 are compared with their respective wild-type ecotype, whereas the double mutant phenotype is reported employing two representative pairs of tsn1 tsn2 and nearly isogenic TSN1EC or TSN2EC control lines (the latter obtained by transformation of tsn1 tsn2 with TSN wild-type loci; see text). (B) Root length of 5-d-old seedlings. Note that a slight but statistically significant root elongation defect of the single mutants is enhanced in tsn1 tsn2. Standard error bars are indicated (n = 43 to 70). *, **: Student's t test, P values < 0.05 or < 0.001, respectively. (C) Detection of TSN by protein blot. An expected band of ∼110 kD is present in the TSNEC plants and completely absent in tsn1 tsn2 (TSN2EC lines systematically overproduced TSN compared with TSN1EC plants). Detection of N-myristoyltransferase (NMT) serves as a control.
Figure 3.
Figure 3.
TSN1 and TSN2 Expression Patterns. (A) GFP patterns of TSN1pro:GFP:TSN1 (TSN1) and TSN2pro:GFP:TSN2 (TSN2) translational fusions in 10-d-old roots. Epifluorescence signals are shown above the corresponding visible light images. Expression maxima locate to the root cap (asterisk) and elongation zone (double asterisk) of the primary apex (left panels) and in lateral root tips, with the TSN2 construct producing a stronger signal. (B) Detection of TSN by protein blots in different organs of Col-0 plants. Coomassie blue staining of a twin gel serves as a control. dag, days after germination; daf, days after flowering. [See online article for color version of this figure.]
Figure 4.
Figure 4.
Salt Hypersensitivity of tsn1 tsn2 and Germination Sensitivity of Single and Double Mutants to Salt and ABA. (A) Fresh weight of plants grown for 17 d on growth medium (GM) supplemented with 100 mM NaCl, reported as percentage of fresh weight on GM. Seedlings were germinated on GM and grown for 4 d before transfer to salt-supplemented or control plates. Standard error bars are indicated (n = 25 to 30). *, Student's t test, P values < 0.05. (B) Representative picture of seedlings grown for 17 d on 150 mM NaCl plates. Note that large rates of mortality occur in tsn1 tsn2 seedlings (white asterisk) soon after transfer to salt-containing media and that growth of surviving individuals is severely stunted. These phenotypes are complemented in controls transformed with the TSN1 locus (TSN1EC). The ratio of plants scored as dead to the total seedlings analyzed is indicated for each genotype. The ratios are significantly different: χ2 test of independence, P value < 0.001. Bar = 1 cm. (C) to (F) Germination on increasing ABA or NaCl concentrations. Germination of the double mutant is clearly hypersensitive to both NaCl (E) and ABA (F). Note that both phenotypes are suppressed in the complemented lines and are already detectable in the single mutants ([C] and [D]). Lines at the sides of genotypes identify mutant/control pairs. *, **: P values < 0.05 or < 0.001, respectively, indicating significant difference from corresponding controls, χ2 test of independence.
Figure 5.
Figure 5.
Reduced Fitness of Soil-Grown tsn1 tsn2 Plants. (A) Rosette morphology (no significant differences were measured) of plants in the growth chamber, under optimal conditions. (B) Main inflorescence length (boxes contain the two central quartiles separated by the median; whiskers extend to the minimum and maximum values observed). (C) Illustration depicting the positions of (I) primary, (II) secondary, and (III) tertiary stems considered for branching analysis. (D) to (H) Fitness traits (n = 12 plants): (D) branching; (E) seed production per plant (seed set); (F) silique density on the main inflorescence (I+); (G) seeds per silique (n = 24); and (H) silique length (n = 24). Standard error bars are shown. In these conditions, siliques were completely filled. *, **: Significant difference: t test P values < 0.05 and < 0.001, respectively. [See online article for color version of this figure.]
Figure 6.
Figure 6.
TSN Subcellular Localization in Root Epidermal Cells. All micrographs represent root epidermal cells at the basal end of the division zone. Bars = 5 μm. (A) Signal of TSN2pro:GFP:TSN2 translational fusion (Col background), merged with the image of propidium iodide–stained cell walls (red signal) and with the visible light image. Note that TSN is excluded from the nucleus and dispersed heterogeneously throughout the cytosol, with a fraction accumulating in a perinuclear fashion. GFP patterns are indistinguishable in the tsn1 tsn2 background and/or with TSN1 fusions (see below). (B) and (C) Comparison of ER-associated GFP and GFP-TSN signals. Note that ER-confined GFP:HDEL and the GFP-TSN are both found in the perinuclear region. (D) to (F) Immunolocalization of TSN in Col roots expressing a GFP marker of the ER lumen (GFP-HDEL). TSN signal (D), GFP-HDEL signal (E), and merge (F). Partial colocalization is particularly apparent around the nucleus. Fusiform GFP structures are ER bodies (Matsushima et al., 2003). (G) to (I) TSN and tubulin signals covisualized by immunolocalization in Col roots. The two patterns are clearly distinct, although compatible with partial colocalization. (J) to (L) Effect of high salinity on TSN subcellular localization at 0 min (J), 15 min (K), and 90 min (L) after transfer to media supplemented with 150 mM NaCl. Note that, at 15 min, the GFP signal is homogeneously dispersed throughout the cytosol. At 90 min, the localization of TSN returns to that of untreated plants.
Figure 7.
Figure 7.
Root Transcriptome of tsn1 tsn2. (A) Venn diagrams representing downregulated and upregulated transcripts in tsn1 tsn2 identified by whole genome comparisons (P < 0.05). tsn1 tsn2 was compared with TSN1EC or TSN2EC on standard media (TSN1 and TSN2) and with TSN1EC on media supplemented with 100 mM NaCl (TSN1 NaCl). (B) Expression of TSN-dependent transcripts (TDR) in roots of 7-d-old seedlings grown in standard conditions (GM) or transferred at 5 d to media supplemented with 100 mM NaCl (NaCl). Values are reported in actin units on a log2 scale and are relative to TSN1EC levels on GM. Key is as in (C). Error bars are standard error of three qPCR replicates. One of three comparable biological replicates is shown. (C) Characterized microRNA targets are not significantly affected in tsn1 tsn2. Samples are as in (B). qPCR primers surrounded the cleavage sites. Additional primers placed downstream of the cleavage site were employed for ARF10 and ARF17 (ARF10’ and ARF17’) to detect also the 3′ cleavage products. One of three comparable biological replicates is shown. (D) Percentage of downregulated transcripts encoding proteins with a predicted signal peptide (SP) in the different microarray experiments, labeled as in (A). The frequencies of SP transcripts in a reference pool of TAIR transcripts within the same abundance and length ranges (Ref. Pool), or in all Arabidopsis mRNAs (TAIR), are included for comparison (see Methods). (E) Markers of the UPR respond normally to chemical induction of UPR in roots of tsn1 tsn2 and TSN1EC. Levels are relative to the complemented control on standard media. One of two comparable biological repeats is shown. −, standard media; Tun., tunicamycin; a.u., actin units.
Figure 8.
Figure 8.
Impact of tsn1 tsn2 on TDRs Expressed in Seeds and Aerial Parts. (A) Transcript levels for two seed expressed TDRs were quantified in mature seeds (DRY), after 24 h of imbibition in water or after 24 h of imbibition in 200 mM NaCl (NaCl). Values, plotted on a log2 scale, are relative to levels in mature seed of the control. Note the 3- to 4-fold reduction of TDR6 levels in mature seeds and in NaCl imbibed seeds of the double mutant. Late embryogenesis abundant mRNA AT3G17520 was included as a control. Seeds were pooled from 12 plants per genotype and showed >90% germination in water. (B) Impact, under NaCl stress, of the tsn1 tsn2 mutation on TDRs known to be present in aerial parts. Note the strong downregulation of TDR2 and TDR4 in aerial parts. A full representation of this experiment can be found in Supplemental Figure 14B online. Error bars are standard errors of three qPCR measurements on two biological repeats. a.u., actin units.
Figure 9.
Figure 9.
Salt Regulation of TSN-Dependent Transcripts in Roots and Aerial Parts. Induction factors of TDR 1-15 in TSN1EC and tsn1 tsn2 roots (closed circles) and aerial parts (open circles), 48 h after transfer of 5-d-old seedlings to solid media supplemented with 100 mM NaCl. Values, plotted on log2 scales and numbered according to Table 1, are the average of qRT-PCR data from two biological repetitions.
Figure 10.
Figure 10.
TSN-Dependent Transcripts Are Destabilized in tsn1 tsn2 Roots. mRNA remaining in roots of tsn1 tsn2 after 0, 2, and 6 h incubation in the presence of cordycepin. Values are relative to levels in TSN1EC and expressed in log2 units, except when noted otherwise. TDR2 to 6 are degraded more rapidly in tsn1 tsn2, in contrast with ABP1 (encoding a secreted protein) included as a control. Data were normalized to the geometric average of ACTIN and IAA2 levels. ARF10 mRNA levels are reported in arbitrary log2 units (u.; negatives of qPCR crossing points), without any normalization. ARF10 levels decrease steeply and similarly in tsn1 tsn2 (filled diamonds) and TSN1EC (open squares), indicating the efficiency of transcriptional inhibition by cordycepin. All experiments were performed in liquid media supplemented with 100 mM NaCl, as described in Methods. TDR1 behaves differentially in liquid conditions (no downregulation at 0 h). Error bars are standard errors of three qPCR measurements on two pooled biological repeats.

Similar articles

Cited by

References

    1. Abe S., Sakai M., Yagi K., Hagino T., Ochi K., Shibata K., Davies E. (2003). A Tudor protein with multiple SNc domains from pea seedlings: Cellular localization, partial characterization, sequence analysis, and phylogenetic relationships. J. Exp. Bot. 54: 971–983 - PubMed
    1. Alonso J.M., et al. (2003). Genome-wide insertional mutagenesis of Arabidopsis thaliana. Science 301: 653–657 - PubMed
    1. Bechtold N., Pelletier G. (1998). In planta Agrobacterium-mediated transformation of adult Arabidopsis thaliana plants by vacuum infiltration. Methods Mol. Biol. 82: 259–266 - PubMed
    1. Bensmihen S., Giraudat J., Parcy F. (2005). Characterization of three homologous basic leucine zipper transcription factors (bZIP) of the ABI5 family during Arabidopsis thaliana embryo maturation. J. Exp. Bot. 56: 597–603 - PubMed
    1. Bensmihen S., To A., Lambert G., Kroj T., Giraudat J., Parcy F. (2004). Analysis of an activated ABI5 allele using a new selection method for transgenic Arabidopsis seeds. FEBS Lett. 561: 127–131 - PubMed

Publication types

MeSH terms

Associated data