

Gene expression profiles of human glioblastomas are associated with both tumor cytogenetics and histopathology
- PMID: 20484145
- PMCID: PMC2940695
- DOI: 10.1093/neuonc/noq050
Gene expression profiles of human glioblastomas are associated with both tumor cytogenetics and histopathology
Abstract
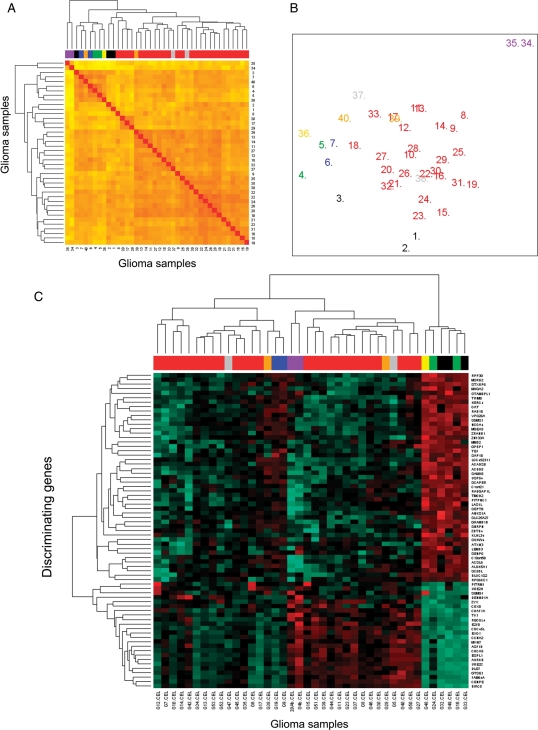
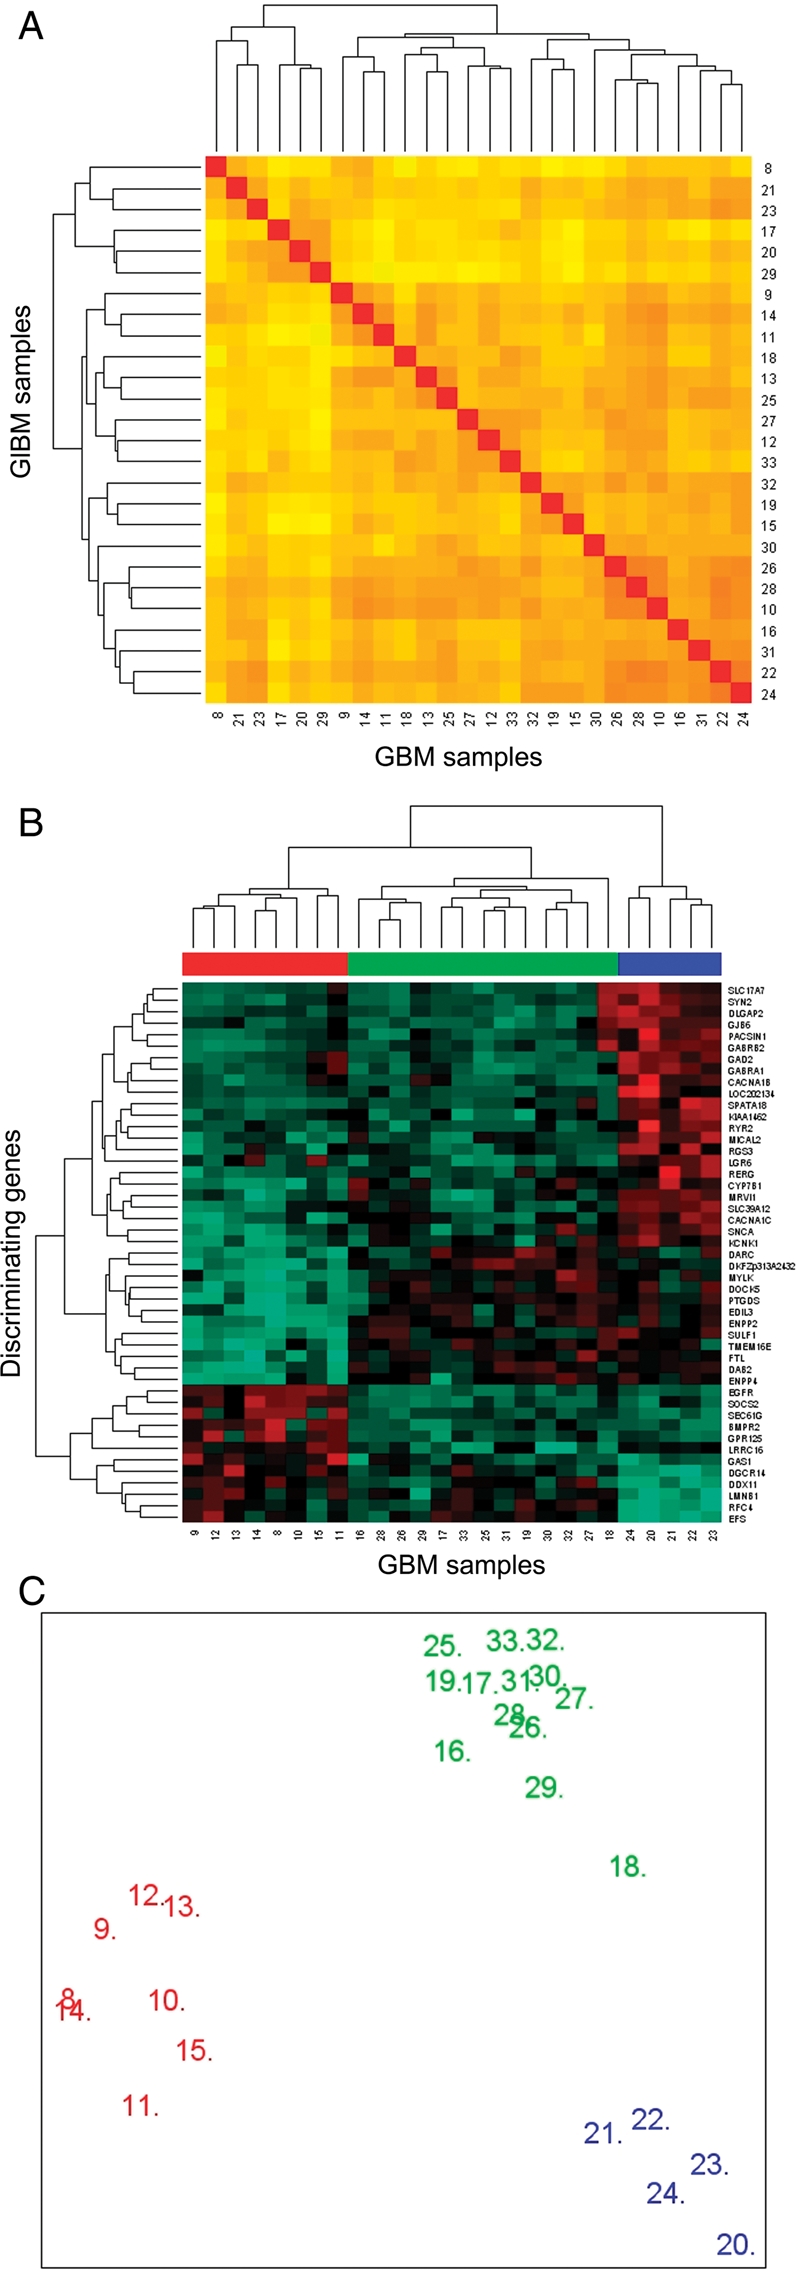
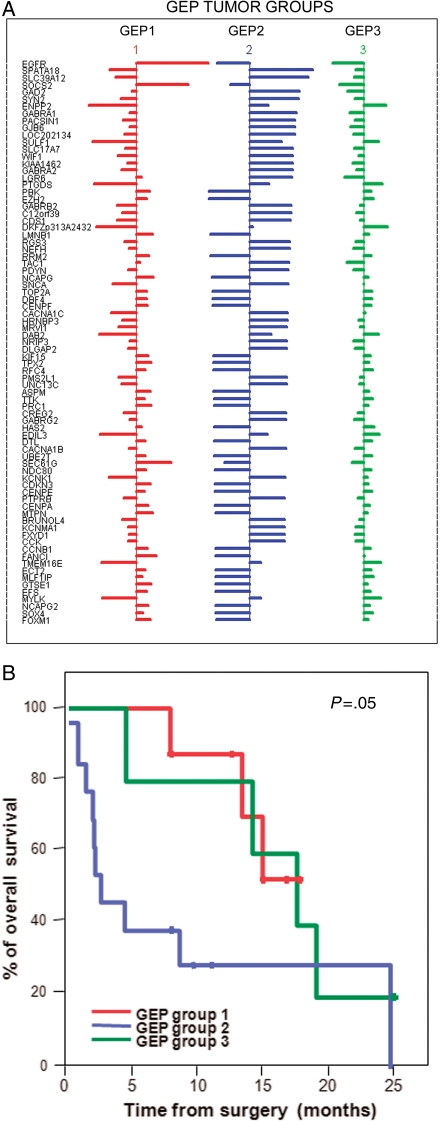
Despite the increasing knowledge about the genetic alterations and molecular pathways involved in gliomas, few studies have investigated the association between the gene expression profiles (GEP) and both cytogenetics and histopathology of gliomas. Here, we analyzed the GEP (U133Plus2.0 chip) of 40 gliomas (35 astrocytic tumors, 3 oligodendrogliomas, and 2 mixed tumors) and their association with tumor cytogenetics and histopathology. Unsupervised and supervised analyses showed significantly different GEP in low- vs high-grade gliomas, the most discriminating genes including genes involved in the regulation of cell proliferation, apoptosis, DNA repair, and signal transduction. In turn, among glioblastoma multiforme (GBM), 3 subgroups of tumors were identified according to their GEP, which were closely associated with the cytogenetic profile of their ancestral tumor cell clones: (i) EGFR amplification, (ii) isolated trisomy 7, and (iii) more complex karyotypes. In summary, our results show a clear association between the GEP of gliomas and tumor histopathology; additionally, among grade IV astrocytoma, GEP are significantly associated with the cytogenetic profile of the ancestral tumor cell clone. Further studies in larger series of patients are necessary to confirm our observations.
Figures
Similar articles
-
Classification of human astrocytic gliomas on the basis of gene expression: a correlated group of genes with angiogenic activity emerges as a strong predictor of subtypes.Cancer Res. 2003 Oct 15;63(20):6613-25. Cancer Res. 2003. PMID: 14583454
-
Gene expression profiles of meningiomas are associated with tumor cytogenetics and patient outcome.Brain Pathol. 2009 Jul;19(3):409-20. doi: 10.1111/j.1750-3639.2008.00191.x. Epub 2008 Jul 15. Brain Pathol. 2009. PMID: 18637901 Free PMC article.
-
Multivariate analysis reveals differentially expressed genes among distinct subtypes of diffuse astrocytic gliomas: diagnostic implications.Sci Rep. 2020 Jul 9;10(1):11270. doi: 10.1038/s41598-020-67743-7. Sci Rep. 2020. PMID: 32647207 Free PMC article.
-
[Histological and molecular classification of gliomas].Rev Neurol (Paris). 2008 Jun-Jul;164(6-7):505-15. doi: 10.1016/j.neurol.2008.03.011. Epub 2008 Jun 10. Rev Neurol (Paris). 2008. PMID: 18565348 Review. French.
-
An update on the epigenetics of glioblastomas.Epigenomics. 2016 Sep;8(9):1289-305. doi: 10.2217/epi-2016-0040. Epub 2016 Sep 2. Epigenomics. 2016. PMID: 27585647 Review.
Cited by
-
Deregulation of ion channel and transporter encoding genes in pediatric gliomas.Front Oncol. 2012 May 30;2:53. doi: 10.3389/fonc.2012.00053. eCollection 2012. Front Oncol. 2012. PMID: 22662319 Free PMC article.
-
Long non‑coding RNA MEG3 suppresses the growth of glioma cells by regulating the miR‑96‑5p/MTSS1 signaling pathway.Mol Med Rep. 2019 Nov;20(5):4215-4225. doi: 10.3892/mmr.2019.10659. Epub 2019 Sep 10. Mol Med Rep. 2019. PMID: 31545491 Free PMC article.
-
ER stress-driven unfolded protein response fuels aging-related tumor aggressiveness in gliomas.Front Mol Biosci. 2025 Jul 11;12:1640038. doi: 10.3389/fmolb.2025.1640038. eCollection 2025. Front Mol Biosci. 2025. PMID: 40718795 Free PMC article.
-
APELA Expression in Glioma, and Its Association with Patient Survival and Tumor Grade.Pharmaceuticals (Basel). 2019 Mar 26;12(1):45. doi: 10.3390/ph12010045. Pharmaceuticals (Basel). 2019. PMID: 30917521 Free PMC article.
-
Programmed Death Ligand 1 Is a Negative Prognostic Marker in Recurrent Isocitrate Dehydrogenase-Wildtype Glioblastoma.Neurosurgery. 2019 Aug 1;85(2):280-289. doi: 10.1093/neuros/nyy268. Neurosurgery. 2019. PMID: 30011045 Free PMC article.
References
-
- Korshunov A, Sycheva R, Golanov A. Molecular stratification of diagnostically challenging high-grade gliomas composed of small cells: the utility of fluorescence in situ hybridization. Clin Cancer Res. 2004;10(23):7820–7826. doi:10.1158/1078-0432.CCR-04-0710. - DOI - PubMed
-
- Louis DN. Molecular pathology of malignant gliomas. Annu Rev Pathol. 2006;1:97–117. doi:10.1146/annurev.pathol.1.110304.100043. - DOI - PubMed
-
- Okamoto Y, Di Patre PL, Burkhard C, et al. Population-based study on incidence, survival rates, and genetic alterations of low-grade diffuse astrocytomas and oligodendrogliomas. Acta Neuropathol. 2004;108(1):49–56. - PubMed
-
- Mischel PS, Nelson SF, Cloughesy TF. Molecular analysis of glioblastoma: pathway profiling and its implications for patient therapy. Cancer Biol Ther. 2003;2(3):242–247. - PubMed
-
- Czernicki T, Zegarska J, Paczek L, et al. Gene expression profile as a prognostic factor in high-grade gliomas. Int J Oncol. 2007;30(1):55–64. - PubMed
Publication types
MeSH terms
LinkOut - more resources
Full Text Sources
Medical
Molecular Biology Databases
Research Materials
Miscellaneous
