

Fasting plasma leptin level is a surrogate measure of insulin sensitivity
- PMID: 20484473
- PMCID: PMC2913039
- DOI: 10.1210/jc.2010-0296
Fasting plasma leptin level is a surrogate measure of insulin sensitivity
Abstract
Context: Published studies indicate marked variability in plasma leptin levels among persons with similar body mass index (BMI). We tested the hypothesis that such variations in leptin levels reflect differences in insulin sensitivity.
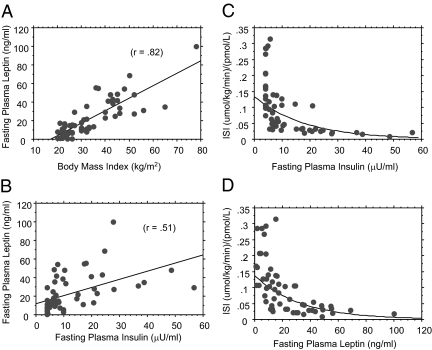
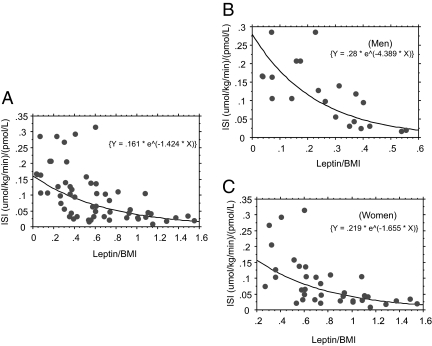
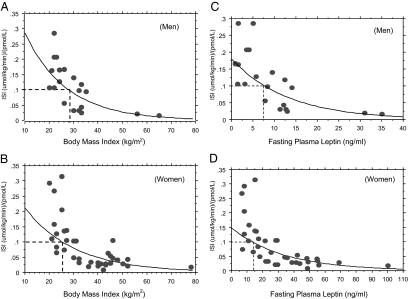
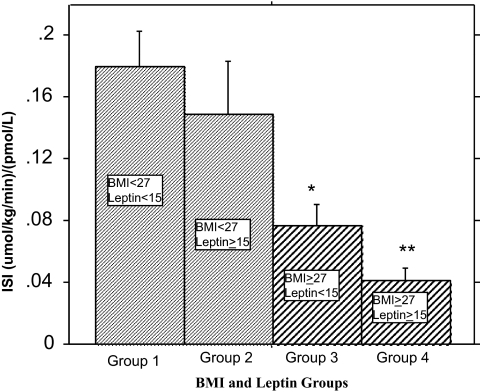
Subjects and methods: Using euglycemic clamp, we assessed insulin sensitivity (ISI) in 57 nondiabetic adults (36 women, 21 men), whose BMI ranged from 20 to 78 kg/m2. We identified 38 age-matched subjects, stratified by fasting leptin (normal, <15 ng/ml vs. high, >or=15 ng/ml) and BMI (nonobese, <27 kg/m2 vs. overweight/obese, BMI>or=27 kg/m2) and compared ISI across the four strata.
Results: Fasting leptin levels correlated with ISI (r=-0.66 in men and -0.60 in women). In a multivariate regression model, leptin emerged as a strong predictor of ISI (r=-0.41, P=0.0002) after controlling for adiposity, whereas insulin weakened as a predictor (r=-0.32, P=0.0116). From regression plots of ISI vs. BMI and leptin, a BMI greater than 27 kg/m2 and a leptin level greater than 15 ng/dl strongly predicted decreased ISI. A fasting leptin cutoff of 15 ng/ml for detection of insulin sensitivity has a sensitivity of 72.7%, specificity of 56.3%, and positive predictive value of 69.6%. Overweight/obese subjects with fasting leptin less than 15 ng/ml were 100% more insulin sensitive than control subjects with leptin greater than 15 ng/ml.
Conclusions: Insulin sensitivity explains about 40% of the variance in fasting leptin levels. Thus, fasting plasma leptin levels probably serve as an endogenous response to ambient insulin resistance and may provide a surrogate measure of insulin action.
Figures
References
-
- Farooqi IS, Jebb SA, Langmack G, Lawrence E, Cheetham CH, Prentice AM, Hughes IA, McCamish MA, O'Rahilly S 1999 Effect of recombinant leptin therapy in a child with congenital leptin deficiency. N Engl J Med 341:879–884 - PubMed
-
- Heymsfield SB, Greenberg AS, Fujioka K, Dixon RM, Kushner R, Hunt T, Lubina JA, Patane J, Self B, Hunt P, McCamish M 1999 Recombinant leptin for weight loss in obese and lean adults: a randomized, controlled, dose escalation trial. JAMA 282:1568–1575 - PubMed
-
- Licinio J, Caglayan S, Ozata M, Yildiz BO, de Miranda PB, O'Kirwan F, Whitby R, Liang L, Cohen P, Bhasin S, Krauss RM, Veldhuis JD, Wagner AJ, DePaoli AM, McCann SM, Wong ML 2004 Phenotypic effects of leptin replacement on morbid obesity, diabetes mellitus, hypogonadism, and behavior in leptin-deficient adults. Proc Natl Acad Sci USA 101:4531–4536 - PMC - PubMed
-
- Pelleymounter MA, Cullen MJ, Baker MB, Hecht R, Winters D, Boone T, Collins F 1995 Effects of the obese gene product on body weight regulation in ob/ob mice. Science 269:540–543 - PubMed
-
- Cohen B, Novick D, Rubinstein M 1996 Modulation of insulin activities by leptin. Science 274:1185–1188 - PubMed
Publication types
MeSH terms
Substances
Grants and funding
LinkOut - more resources
Full Text Sources
Medical
