. 2010 Aug;84(15):7473-83.
doi: 10.1128/JVI.00299-10. Epub 2010 May 19.

Cellular transcription factor ZASC1 regulates murine leukemia virus transcription

Affiliations

Cellular transcription factor ZASC1 regulates murine leukemia virus transcription

James W Bruce et al. J Virol. 2010 Aug.

Abstract

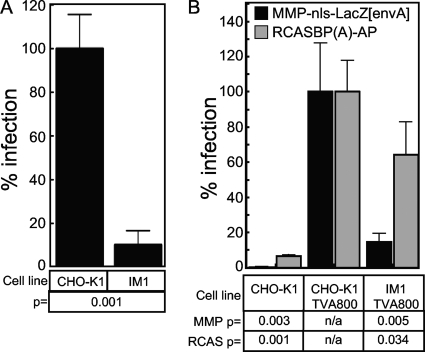
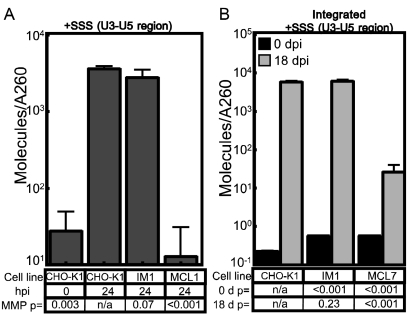
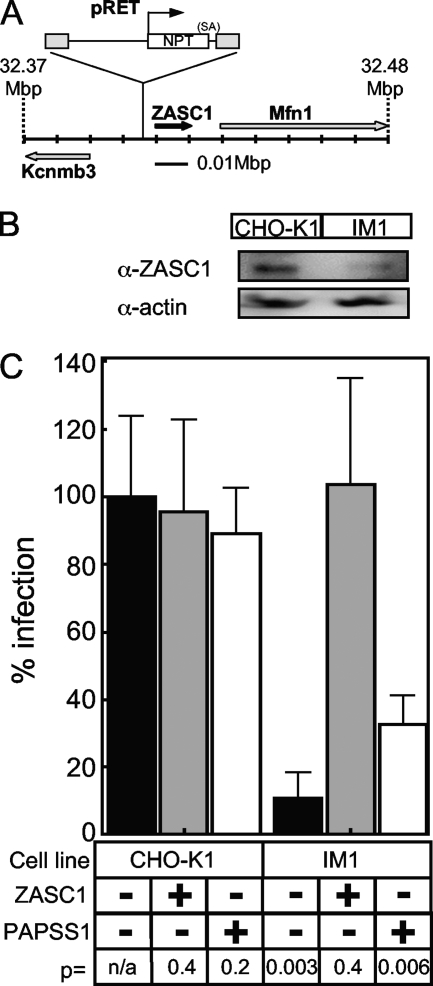
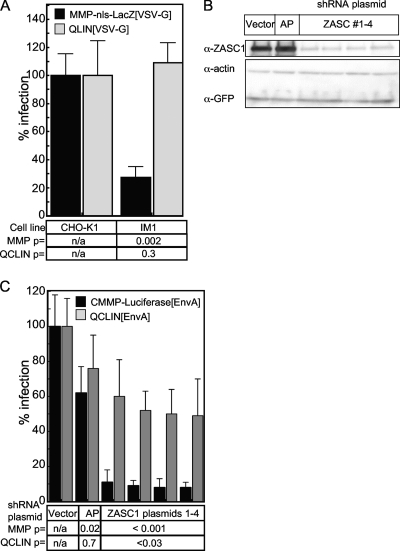
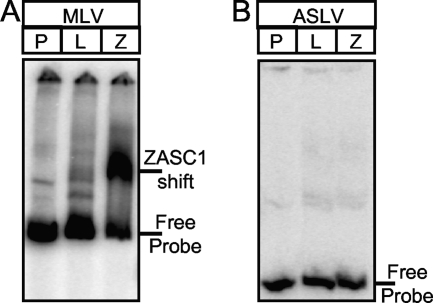
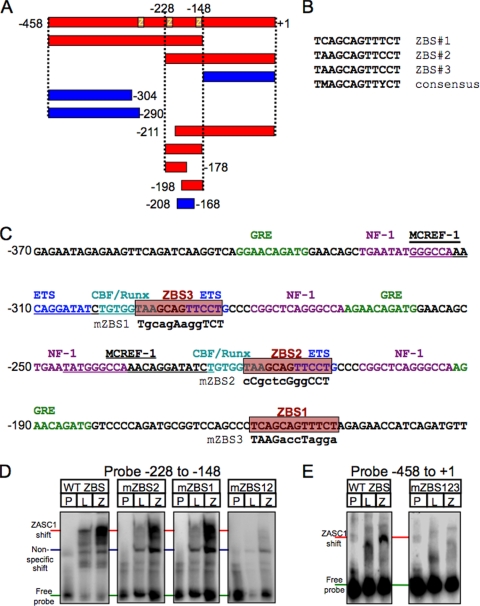
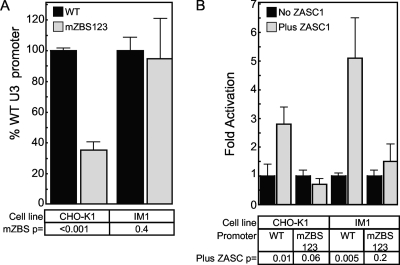
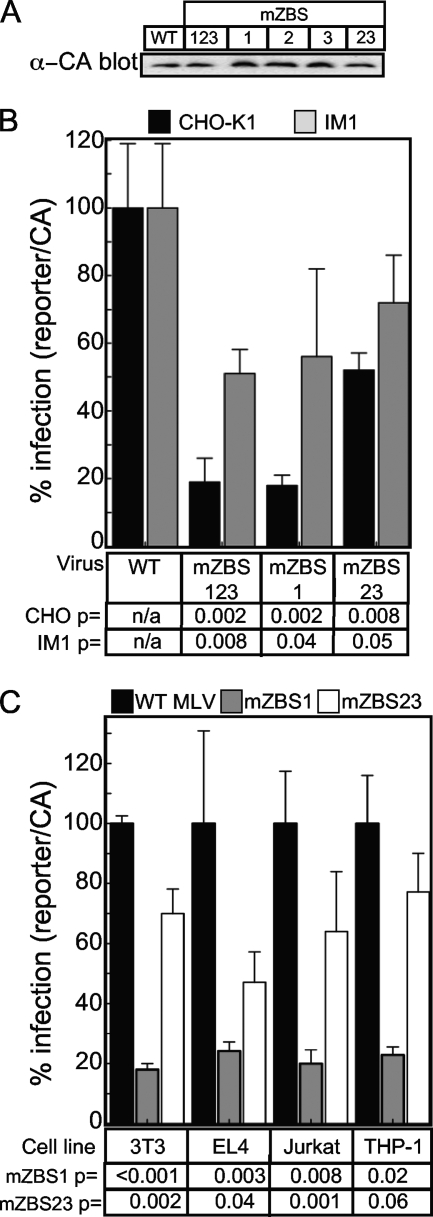
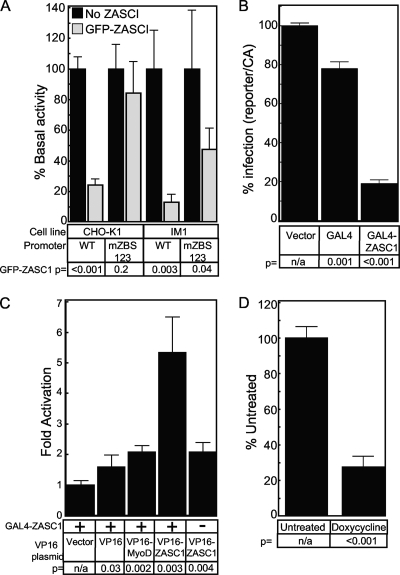
To identify cellular processes involved in retroviral infection, we employed a high-volume forward genetic screen of insertionally mutagenized somatic cells using a murine leukemia virus (MLV) vector. This approach identified a clonal cell line that exhibited approximately 10-fold reduced gene expression from MLV vectors following infection despite supporting normal levels of MLV reverse transcription and integration. The defect in this cell line was specific for the MLV long terminal repeat (LTR) promoter, as normal levels of reporter gene expression were obtained from both an internal cytomegalovirus (CMV) promoter contained within an LTR-defective MLV vector and LTR expression from an avian sarcoma and leukosis virus (ASLV) vector. Complementation and shRNA knockdown experiments demonstrated that the defective gene in these cells is ZASC1 (ZNF639), a transcription factor with strong links to cancer and inherited ataxias. We demonstrated that ZASC1 is a sequence-specific DNA binding protein with three closely related binding sites located within the MLV LTR promoter, but it does not bind to the ASLV promoter. Mutating these putative ZASC1 binding sites significantly reduced levels of MLV gene expression. While wild-type ZASC1 activated expression from the MLV promoter, a green fluorescent protein-ZASC1 fusion protein showed dominant-negative inhibition of MLV gene expression. These studies identify the cellular transcription factor ZASC1 as an activator of MLV gene expression and provide tools that should be useful in studying the links between ZASC1 and human diseases.


Figures

FIG. 1.
FIG. 1.
Resistance of the IM1 cell line maps to the MLV core. (A) CHO-K1 and IM1 cells were challenged with serial dilutions of the VSV-G-pseudotyped MLV vector (MMP-nls-LacZ[VSV-G]), encoding β-galactosidase. The cells then were stained 48 hpi with X-Gal, the number of blue cells were counted, and the data were reported as the percentage of LacZ-transducing units (LTU) obtained from WT CHO-K1 infections (5 × 10⁵ LTU). The data shown are the averages from three experiments each performed with triplicate samples. (B) CHO-K1 cells and IM1 cells engineered to express TVA800 or wild-type CHO-K1 cells were challenged with either pMMp-nls-LacZ[envA], an EnvA-pseudotyped MLV vector encoding β-galactosidase, or with RCASBP(A)-AP, an ALSV-A vector encoding heat-stable alkaline phosphatase. Infection was monitored using chemiluminescent assays to detect reporter enzyme activities along with a chemiluminescent assay to measure relative viable cell numbers. The ratios of enzyme activities to relative viable cell number were calculated for each sample and compared to values from CHO-K1 TVA 800 cells (defined as 100% infection). The data shown are the average mean values obtained in an experiment performed with quadruplicate samples and are representative of three independent experiments. Error bars indicate the standard deviations from the data. P values were calculated using a standard Student's t test.
FIG. 2.
FIG. 2.
IM1 cells support WT levels of MLV reverse transcription and integration. (A) CHO-K1, IM1, and MCL7 cell lines were challenged with the VSV-G-pseudotyped MLV vector LEGFP, and total DNA was isolated at 0 or 24 hpi, DNA concentration was quantitated by A260, and a real-time PCR amplification analysis was performed to measure the levels of viral DNA. (B) CHO-K1, IM1, and MCL7 cells were challenged with the same VSV-G-pseudotyped MLV vector as that used in panel A, and total DNA was harvested at 1 or 18 days postinfection for real-time PCR quantitation of viral DNA products. The chemically mutagenized cell line MCL1 displays a strong block to MLV reverse transcription, while the MCL7 cell line displays a strong block to MLV DNA integration (6). The data shown are the average mean values obtained in independent experiments performed with triplicate samples, and each is representative of three independent experiments. Error bars indicate the standard deviations of the data. P values were calculated using a standard Student's t test.
FIG. 3.
FIG. 3.
Reduced expression of ZASC1 is responsible for the MLV resistance phenotype of IM1 cells. (A) Since the hamster genome has not been sequenced, the integration of pRET was modeled on the mouse genome (chromosome 3, position 32.37 to 32.48 Mbp). The pRET provirus integration is expanded, and the orientation of the neomycin phosphotransferase (NPT) transcript and the splice acceptor site are shown in relation to the viral LTR (gray boxes). The relative locations and orientation of the pRET integration site ZASC1, potassium channel Kcnmb3, and the mitochondrial fusion gene Mfn1 are shown. (B) Immunoblot analysis of cell lysates from CHO-K1 and IM1 cells performed with rabbit polyclonal antibodies against human ZASC1 or human actin (α-ZASC1 and α-actin, respectively). The blots were washed, treated with a secondary anti-rabbit horseradish peroxidase conjugate, and imaged by chemiluminescence. The blots are representative of three independent experiments. (C) CHO-K1 and IM1 cells engineered to express either a human ZASC1 cDNA or a control human PAPSS1 cDNA were challenged with serial dilutions of the VSV-G-pseudotyped MLV vector (MMP-nls-LacZ[VSV-G]) encoding β-galactosidase. The cells then were stained 48 hpi with X-Gal, the numbers of blue cells were counted, and the data were reported as the percentage of LacZ-transducing units (LTU) obtained with WT CHO-K1 cells (5 × 10⁵ LTU). The data shown are the averages from three experiments, each performed with triplicate samples. P values were calculated using a standard Student's t test.
FIG. 4.
FIG. 4.
ZASC1 regulates expression from the MLV LTR promoter. (A) CHO-K1 or IM1 cells were challenged with the VSV-G-pseudotyped MLV vector MMP-nls-LacZ, which drives LacZ expression from the MLV-LTR promoter, or pQCLIN, a self-inactivating vector with defective LTRs and an internal HCMV promoter that drives LacZ expression. (B) Western blot analysis of HEK293T transiently transfected with GFP and ZASC1 expression plasmid and plasmids expressing either one of four shRNAs targeting the open reading frame of ZASC1, a control shRNA targeting secreted alkaline phosphatase (AP), or the empty shRNA vector. Cell lysates were analyzed by Western blotting as described in Materials and Methods with rabbit antibodies against human ZASC1, human actin, and GFP. The blot is representative of three independent experiments. (C) HEK293T cells were transiently transfected with 80 ng of plasmids expressing either one of four shRNAs targeting the open reading frame of ZASC1, a control shRNA targeting secreted alkaline phosphatase (AP), or the empty shRNA vector along with 20 ng of an expression vector encoding the ASLV receptor TVA800 (2, 35). Three days posttransfection, cells were challenged with EnvA-pseudotyped MLV vectors, either CMMP-luciferase, which directs MLV LTR-driven firefly luciferase gene expression, or pQCLIN, which directs β-galactosidase expression from an internal HCMV promoter. Infection was monitored using chemiluminescent assays to detect reporter enzyme activities along with a chemiluminescent assay to measure relative viable cell numbers, and the data are reported as the ratio of reporter gene activity to the relative viable cell number observed, with CHO-K1 cells defined as 100% infection. The data shown are the average mean values obtained in an experiment performed with quadruplicate samples, and each is representative of three independent experiments. Error bars indicate the standard deviations of the data. P values were calculated using a standard Student's t test.
FIG. 5.
FIG. 5.
ZASC1 binds to the MLV LTR. EMSA of DNA fragments corresponding to the U3 promoter regions of MLV (−458 to +1) (A) and ASLV (−233 to −64) (B) that were end labeled with γ-32P and mixed with in vitro transcription translation reaction mixtures containing either luciferase (L) or ZASC1 (Z) proteins. Protein/DNA complexes were resolved on 4% TBE polyacrylamide gels, dried, and exposed to phosphorimager plates. Lanes containing DNA probe alone (P) are indicated, as are the positions of the free probe and the ZASC1-specific band.
FIG. 6.
FIG. 6.
ZASC1 binds to three highly related sites in the MLV promoter. (A) DNA restriction fragments or oligonucleotides corresponding to the indicated regions of the MLV promoter were tested for the ability to bind to ZASC1 as described for Fig. 4. Those that bound ZASC1 are indicated in red, and those that did not bind are in blue. (B) Alignment of three putative ZASC1 binding sites (ZBS) in the MLV promoter. (C) The MLV U3 region from nucleotides −370 to −131 is shown with the location of previously characterized transcription factor sites: glucocorticoid response element (GRE) (green), nuclear factor 1 (NF-1) (purple), ETS sites (dark blue), CBF/Runx sites (light blue), and MCREF-1 sites (underlined). Red boxes indicate the locations of the three ZASC1 binding sites. Mutations introduced into the ZASC1 binding sites to test the effect of mutation on ZASC1 binding and MLV infection are indicated underneath the WT sequence. (D) EMSA of oligonucleotides corresponding to the −228 to −148 MLV U3 fragment with either ZBS1 or ZBS2 mutated. The locations of free probe, nonspecific shifts, and the specific ZASC1 bandshift are indicated. The data shown are representative of at least three independent experiments. (E) EMSA of the complete WT MLV U3 DNA fragment or the corresponding version with all three ZBS sites mutated (mZBS123).
FIG. 7.
FIG. 7.
ZASC1 activates the expression of the MLV promoter. (A) Basal activity of a plasmid encoding Gaussia luciferase under the control of either the WT MLV LTR promoter or a promoter with all three ZBS mutated in transiently transfected CHO-K1 or IM1 cells. Promoter activity of the WT plasmid is set to 100% for each cell line. (B) CHO-K1 or IM1 cells transiently transfected with WT or mZBS reporter constructs with or without a ZASC1 expression plasmid. WT and mZBS promoter activity in the absence of ZASC1 in each cell line was set to 1, and fold-activation in the presence of ZASC1 was determined as described in Materials and Methods. The data shown are the average mean values obtained in an experiment performed with quadruplicate samples, and each is representative of three independent experiments. Error bars indicate the standard deviations of the data. P values were calculated using a standard Student's t test.
FIG. 8.
FIG. 8.
Mutation of ZASC1 binding sites inhibits MLV vector gene expression. (A) Capsid Western blot (α-CA) analysis of representative viral supernatants used in infection assays. (B) Reporter assays of CHO-K1 or IM1 cells challenged with MLV vectors expressing SEAP under the control of either the WT MLV U3 promoter, a U3 promoter with all 3 ZASC1 binding sites mutated (mZBS123), binding site 1 mutated (mZBS1), or both binding sites 2 and 3 mutated (mZBS23). (C) Reporter assays of mouse fibroblast (3T3), mouse T-cell (EL4), human T-cell (Jurkat), or human monocyte (THP-1) cell lines challenged with MLV vectors expressing firefly luciferase and containing either the mZBS1 or mZBS2 mutation. Infection was monitored using chemiluminescent assays to detect reporter enzyme activities. Infections were normalized to input virus as determined by anti-capsid Western blotting and are reported as the ratio of reporter gene activity to input capsid observed. The data obtained with the WT constructs is defined as 100% infection. The data shown are the average mean values obtained in an experiment performed with quadruplicate samples, and each is representative of three independent experiments. P values were calculated using a standard Student's t test.
FIG. 9.
FIG. 9.
GFP-ZASC1 fusion protein inhibits expression from the MLV promoter. (A) CHO-K1 or IM1 cells transiently transfected with WT or mZBS reporter constructs with or without a GFP-ZASC1 expression plasmid. WT and mZBS promoter activity in the absence of GFP-ZASC1 in each cell line was set to 100%, and activity in the presence of GFP-ZASC1 was determined as described in Materials and Methods. (B) GAL4-ZASC1 fusion protein inhibits expression from an artificial promoter with five GAL4 binding sites upstream of a TATA box. HEK293 cells transiently transfected with a GAL4 reporter construct and either GAL4 or GAL4 expression plasmids. Promoter activity in transfections with empty vector were set to 100%, and activity levels in the presence of GAL4 and GAL4-ZASC1 expression plasmids were determined as described in Materials and Methods. (C) Mammalian two-hybrid analysis of GAL4-ZASC1 fusion protein. HEK293 cells transiently transfected with a GAL4-ZASC1 expression plasmid and an additional expression plasmid encoding a VP16 activation domain fusion protein. (D) CHO-TREX cells (CHO-K1 cells expressing the Tet repressor) were stably transduced with a lentivirus construct encoding a Tet-inducible GFP-ZASC1 fusion protein. GFP-ZASC1 expression was induced with 1 μg/ml doxycycline, and 24 h postinduction the cells were infected with the VSV-G-pseudotyped MLV vector (MMP-nls-LacZ[VSV-G]) encoding β-galactosidase. Reporter gene expression from the newly acquired virus was monitored 72 h postinduction using chemiluminescent assays, and the data are reported with no doxycycline treatment defined as 100% infection. The data shown are the average mean values obtained in an experiment performed with quadruplicate samples, and each is representative of three independent experiments. Error bars indicate the standard deviations of the data. P values were calculated using a standard Student's t test.

Similar articles

Cited by

References

    1. Adkins, H. B., S. C. Blacklow, and J. A. Young. 2001. Two functionally distinct forms of a retroviral receptor explain the nonreciprocal receptor interference among subgroups B, D, and E avian leukosis viruses. J. Virol. 75:3520-3526. - PMC - PubMed
    1. Bates, P., J. A. Young, and H. E. Varmus. 1993. A receptor for subgroup A Rous sarcoma virus is related to the low density lipoprotein receptor. Cell 74:1043-1051. - PubMed
    1. Bogaerts, S., A. Vanlandschoot, J. van Hengel, and F. van Roy. 2005. Nuclear translocation of alphaN-catenin by the novel zinc finger transcriptional repressor ZASC1. Exp. Cell Res. 311:1-13. - PubMed
    1. Brass, A. L., D. M. Dykxhoorn, Y. Benita, N. Yan, A. Engelman, R. J. Xavier, J. Lieberman, and S. J. Elledge. 2008. Identification of host proteins required for HIV infection through a functional genomic screen. Science 319:921-926. - PubMed
    1. Bruce, J. W., P. Ahlquist, and J. A. Young. 2008. The host cell sulfonation pathway contributes to retroviral infection at a step coincident with provirus establishment. PLoS Pathog. 4:e1000207. - PMC - PubMed

Publication types

Substances

LinkOut - more resources