. 2010 Aug;84(15):7543-57.
doi: 10.1128/JVI.00477-10. Epub 2010 May 19.

Phosphatidylinositol 3-kinase-, actin-, and microtubule-dependent transport of Semliki Forest Virus replication complexes from the plasma membrane to modified lysosomes

Affiliations

Phosphatidylinositol 3-kinase-, actin-, and microtubule-dependent transport of Semliki Forest Virus replication complexes from the plasma membrane to modified lysosomes

Pirjo Spuul et al. J Virol. 2010 Aug.

Abstract

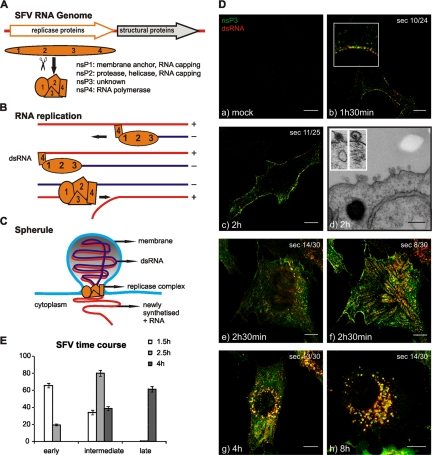
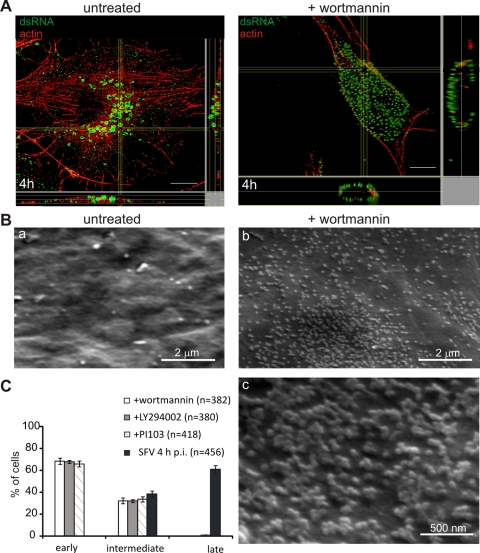
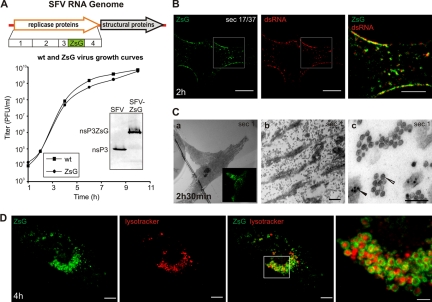
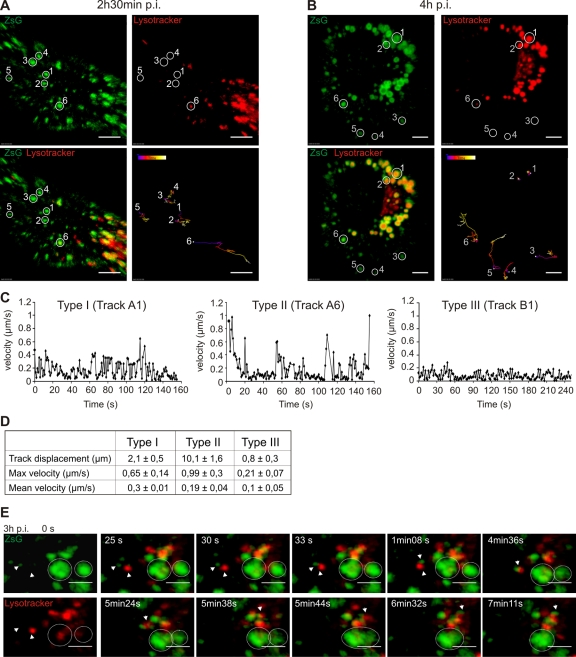
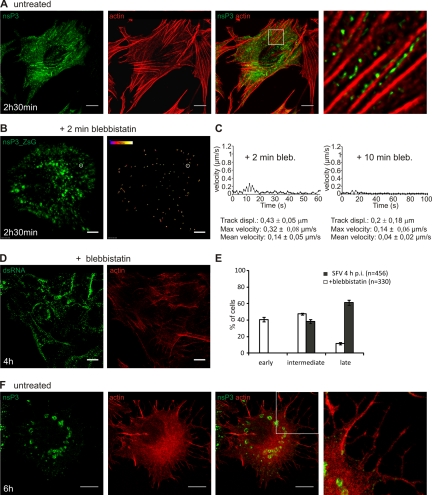
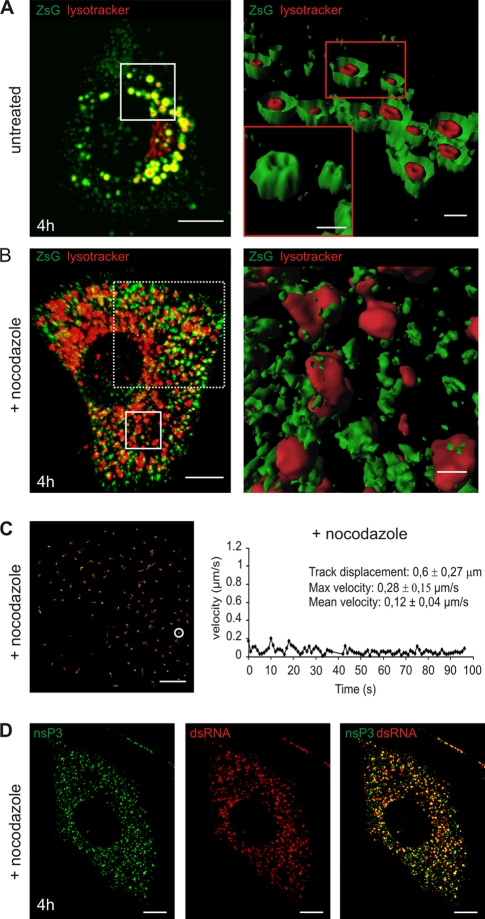
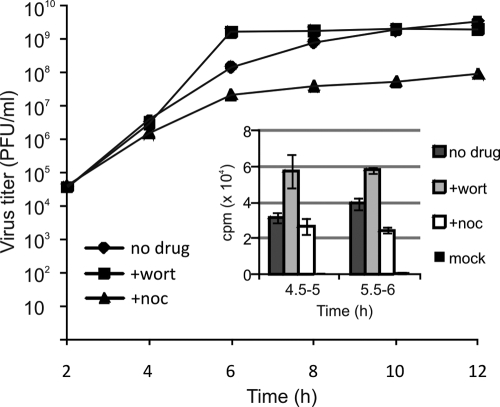
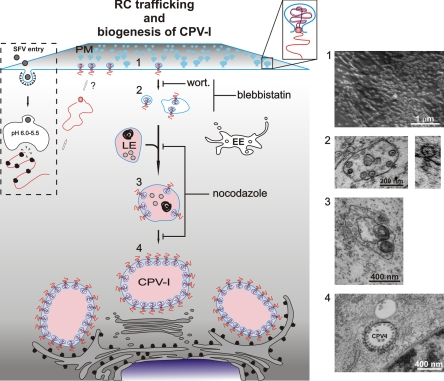
Like other positive-strand RNA viruses, alphaviruses replicate their genomes in association with modified intracellular membranes. Alphavirus replication sites consist of numerous bulb-shaped membrane invaginations (spherules), which contain the double-stranded replication intermediates. Time course studies with Semliki Forest virus (SFV)-infected cells were combined with live-cell imaging and electron microscopy to reveal that the replication complex spherules of SFV undergo an unprecedented large-scale movement between cellular compartments. The spherules first accumulated at the plasma membrane and were then internalized using an endocytic process that required a functional actin-myosin network, as shown by blebbistatin treatment. Wortmannin and other inhibitors indicated that the internalization of spherules also required the activity of phosphatidylinositol 3-kinase. The spherules therefore represent an unusual type of endocytic cargo. After endocytosis, spherule-containing vesicles were highly dynamic and had a neutral pH. These primary carriers fused with acidic endosomes and moved long distances on microtubules, in a manner prevented by nocodazole. The result of the large-scale migration was the formation of a very stable compartment, where the spherules were accumulated on the outer surfaces of unusually large and static acidic vacuoles localized in the pericentriolar region. Our work highlights both fundamental similarities and important differences in the processes that lead to the modified membrane compartments in cells infected by distinct groups of positive-sense RNA viruses.


Figures

FIG. 1.
FIG. 1.
Replication scheme and time course of SFV infection. (A) Schematic view of the SFV genome and expression of the ns proteins. The main functions of the individual ns proteins are shown. (B) RNA replication strategy of SFV through a dsRNA intermediate. Although the replication intermediate is shown as entirely double stranded, the actual extent of the dsRNA is not known. (C) Model of the replication-induced membrane structure, or spherule, with replicase proteins shown at the neck and a dsRNA molecule located inside the spherule. Newly synthesized positive-sense RNA is released to the cytoplasm. Proteins are not shown to scale. Multiple copies of replication proteins could be located throughout the spherule (24). (D) Localization of SFV RCs in a time course. BHK cells were either mock infected or infected with SFV at 50 PFU/cell, and samples were fixed at the indicated time points p.i. RCs were detected with anti-nsP3 (green) and anti-dsRNA (red) antibodies. Colocalization (yellow) represents active RCs. Samples were analyzed with confocal microscopy, and representative optical sections from the middles of the cells are shown. The total number of sections (sec) per cell is also given. (a) Mock-infected sample. (b and c) Samples fixed at 1 h 30 min (b) and 2 h (c) demonstrate the accumulation of the RCs at the PM. (d) The EM cross section corresponding to panel c shows the spherules at the PM. (Inset) A virus particle at the outer surface of the PM (left) appears similar in size but morphologically distinct from a spherule (right). (e and f) For the sample fixed at 2 h 30 min, both a middle (e) and a bottom (f) section are shown. (g and h) Images of samples fixed at 4 h (g) and 8 h (h) demonstrate the later phenotype with perinuclear CPVs. Bars, 10 μm for confocal microscopy images and 200 nm for the EM image. (E) Visual profiling. Phenotypes were defined according to the localization of RCs in a time course of infection with 500 PFU/cell. Images of 5 fields per coverslip at each time point were randomly selected, and approximately 100 cells were marked in each field. According to the localization pattern of the RCs, the cells were grouped into three phenotype categories: early (PM staining), intermediate (PM staining and small RC-containing vesicles), and late (larger perinuclear RC-containing vesicles [CPV-I]).
FIG. 2.
FIG. 2.
Involvement of PI3K in the trafficking of the RCs. (A) Wortmannin blocks RCs at the PM. Untreated cells and cells treated with 100 nM wortmannin were analyzed by orthogonal optical sectioning. In the untreated sample, dsRNA-positive CPV (green) are located in the perinuclear area at 4 h p.i., but wortmannin inhibits the internalization of the RCs. Cell contours are shown by staining of actin with phalloidin-AF568 (red). Bars, 10 μm. (B) Parallel samples were analyzed by scanning electron microscopy. (a) An untreated sample shows a clear PM with very few spherules at 4 h p.i. (b) In a wortmannin-treated sample, the PM is filled with spherules. (c) High magnification of an area acquired from an adjacent field of the treated sample, showing that spherules appear in clusters. (C) Quantification of the localization of RCs in the presence of 100 nM wortmannin, 50 μM LY294002, or 200 nM PI-103 compared to the localization of RCs in an untreated sample. Infected cells from four fields (n indicates the total number of the cells analyzed) were quantified for RC localization. Error bars represent SDs.
FIG. 3.
FIG. 3.
Analysis of replication of SFV-ZsG in fixed and live cells. (A) (Top) Schematic view of the SFV-ZsG genome. The insertion of the ZsG sequence is highlighted. (Bottom) The growth curve of SFV-ZsG is compared to that of the wt SFV4 virus. BHK cells were infected with 10 PFU/cell, and aliquots were taken every 2 h. Titers (PFU/ml) were determined by a plaque assay. At 10 h, cells were lysed, and samples were analyzed by Western blotting with anti-nsP3 antibodies to verify the presence of the fusion protein nsP3-ZsG (shown in the inset). (B) PM localization of RCs containing ZsG early in infection. BHK cells were infected with SFV-ZsG at 500 PFU/cell and were fixed at 2 h p.i. An anti-dsRNA antibody (red) was used to confirm the presence of ZsG in replication complexes. A representative confocal section is shown. The area that is boxed in the left and center panels is displayed at higher magnification on the right and shows the colocalization of the dsRNA and ZsG signals. Bars, 10 μm (left and center) and 5 μm (right). (C) Correlative light-electron microscopy (CLEM) was used to study the RCs at the bottom of the cell. BHK cells were infected with SFV-ZsG VRPs (MOI, 500), and at 2 h 30 min p.i., cells were fixed with glutaraldehyde. (a) A representative infected cell was imaged with a confocal microscope (inset image in green). The same cell was relocated by EM, and the first horizontal section (sec 1) was analyzed. (b) A higher magnification of the same cell shows massive amounts of spherules at the bottom of the cell. Bar, 1 μm. (c) Higher magnification of panel b, showing clusters of spherules (white arrowhead) distinct from the nucleocapsids (black arrowhead). Bar, 200 nm. (D) Live-cell imaging of BHK cells infected with SFV-ZsG VRPs (MOI, 500). The cellular acidic compartment was visualized by LysoTracker (red). Images were captured at 4 h p.i. with confocal microscopy. 3D reconstruction of the entire cell is shown (see Materials and Methods). Bars, 10 μm (left and central panels) and 3 μm (rightmost panel).
FIG. 4.
FIG. 4.
Intracellular dynamics of RCs at different stages of infection. (A and B) Confocal live-cell imaging of BHK cells infected with SFV-ZSG VRPs (MOI, 500). LysoTracker (red) highlights the acidic cellular organelles. The tracking of six ZsG-positive vesicles is shown. The respective vesicles are circled in split channels (at the top) and also in the merged image (bottom left); these images represent the first frame of the recording. Tracks are color coded according to time, as indicated on the images. Bars, 5 μm. The rate of the recording was 0.5 frame/s (0.5 Hz). (A) Different dynamics of RCs early in infection (2 h 30 min p.i.). Tracks 1 to 5 represent type I movements, and track 6 represents type II movements. Note that only vesicle 6 is acidic. The total recording time was 5 min 21 s. (B) Dynamics of RCs late in infection (4 h p.i.). Tracks 1 and 2 (type III) show the movements of late acidic ZsG-positive vesicles (CPV-I), which are mostly immobile. Tracks 3 and 4 show the movements of small RC-containing vesicles that are not acidic (type I), and tracks 5 and 6 demonstrate directed long-distance type II dynamics. Vesicle 5 becomes acidified during the recording, and vesicle 6 is already acidic at the beginning of the movie (see video S3 in the supplemental material). The total recording time was 4 min 40 s. (C) Representative track charts for type I (track A1), type II (track A6), and type III (track B1) movements. The changes in velocity during the recordings are shown. (D) Summary table of the three types of movements of RC-positive vesicles during the SFV infection cycle. Track displacement and maximum and mean velocities are shown; SDs were calculated based on six tracks. (E) Live-cell imaging of BHK cells infected with SFV-ZSG VRPs (MOI, 500) at 3 h p.i. (see video S4 in the supplemental material). LysoTracker (red) highlights the cellular acidic organelles. The frames were recorded at the rate of 1 frame/s (1 Hz) over 7 min 35 s. Split channels are shown at time zero (left top and bottom panels); otherwise, merged images are presented. The fast fusion of an early ZsG-positive vesicle (not acidic) with a preexisting acidic organelle is indicated by arrowheads, and its long-distance movement to the pericentriolar area is followed. In the same movie, the slow fusion of two CPVs is indicated by circled areas. Bars, 3 μm.
FIG. 5.
FIG. 5.
The actin network is utilized early in infection. (A) RCs are aligned at the bottom of the cell following the direction of actin fibers. BHK cells were infected with SFV (MOI, 50) and were fixed at 2 h 30 min p.i. RCs were stained with an anti-nsP3 antibody (green), and actin was visualized with phalloidin-AF568 (red). Bar, 10 μm. The boxed area is shown at a higher magnification in the rightmost panel. (B) Blebbistatin freezes all the movements of RCs in live cells. BHK cells were infected with SFV-ZsG VRPs (MOI, 500), and 30 nM blebbistatin was added at 2 h 30 min p.i. Imaging was started 2 min after the addition of the drug. Representative tracks are shown (image on the right). The rate of the recording was 0.5 frame/s (0.5 Hz). The total recording time was 3 min 44 s. Images represent the first frame of the recording. Bar, 5 μm. (C) (Left) Track of the vesicle circled in panel B (after exposure to blebbistatin for 2 min). (Right) Illustrative track from a 10-min treatment with blebbistatin. Under the graphs, statistics for six representative tracks are shown. (D) Blebbistatin treatment delays the inward movement of the RCs and the maturation of the CPV. BHK cells were infected with SFV (MOI, 500), and 30 nM blebbistatin was added at 1 h 30 min p.i. Samples were fixed at 4 h p.i. and were stained with an anti-dsRNA antibody (green) and phalloidin-AF568 (red). (E) The localization of the RCs was quantified in four fields (n indicates the total number of the cells analyzed) and was compared to that in an untreated sample. Error bars represent SDs for two independent experiments. (F) Actin disruption later in infection. BHK cells were infected with SFV (MOI, 50) and were fixed at 6 h p.i. The sample was stained as described for panel A. The boxed area is shown at a higher magnification in the rightmost panel, displaying the virus-induced filopodium-like extensions that contain actin. Bars, 10 μm.
FIG. 6.
FIG. 6.
Involvement of microtubules in the transport of CPV to the perinuclear area. (A to C) Confocal live-cell imaging of SFV-infected cells, either untreated or in the presence of nocodazole (from the beginning of infection). BHK cells were infected with SFV-ZsG VRPs (MOI, 500), and imaging was performed at 4 h p.i. LysoTracker (red) was used to stain the acidic organelles. (A) (Left) Untreated sample, showing the late phenotype and the ZsG signal around the acidic organelles. (Right) Isosurface representation of the area boxed on the left. CPV were cut in half to illustrate the ZsG signal surrounding the LysoTracker staining. (Inset) Intact CPV in the boxed area, hiding the LysoTracker signal. (B) (Left) In the presence of nocodazole, RC-containing vesicles stay scattered. They are not transported to the perinuclear area, and only some ZsG signal colocalizes with LysoTracker as small patches on the surfaces of acidic organelles. The area boxed with solid lines was chosen for isosurface representation, while the area boxed with dashed lines was used for tracking of the RCs in panel C. Bar, 10 μm. (Right) Isosurface representation. Bar, 1 μm. (C) Tracking of the RCs in a nocodazole-treated sample. The rate of the recording was 0.5 frame/s (0.5 Hz). The total recording time was 1 min 36 s. Representative tracks are shown; statistics for one track (circled) are given on the right. Bar, 5 μm. (D) Nocodazole treatment does not interfere with the replication of SFV. BHK cells were infected with SFV (MOI, 500) in the presence of nocodazole, and cells were fixed at 4 h p.i. The scattered nsP3-positive vesicles (green) are also positive for dsRNA staining (red). Bars, 10 μm.
FIG. 7.
FIG. 7.
Virus replication in the presence of inhibitors. One step growth curves of SFV-ZsG in the presence of wortmannin or nocodazole are shown. Released viruses were withdrawn at 2-h intervals as indicated, and virus titers were measured by direct fluorescence (see Materials and Methods). (Inset) Effects of the same inhibitors on SFV RNA synthesis. Infected BHK cells were pulse-labeled with [3H]uridine at the indicated times, and labeled RNA was measured by scintillation counting after TCA precipitation. The results are averages for two independent experiments; error bars represent SDs.
FIG. 8.
FIG. 8.
Model for the trafficking of alphavirus RCs and the biogenesis of CPV-I. After SFV entry, which occurs via clathrin-mediated endocytosis, low-pH-triggered fusion releases the nucleocapsids, and viral mRNA is translated into a polyprotein. Protein-RNA complexes are transported to the PM by an unknown mechanism (white arrows). At the PM, spherule structures are formed (step 1), followed by endocytosis in a PI3K (inhibition by wortmannin)- and actin-myosin (inhibition by blebbistatin)-dependent manner. Small internalized vesicles carry a few spherules (step 2), and many homotypic fusions, as well as fusions with late endosomes, occur (step 3 [inhibition by nocodazole]). These larger, acidic, RC-containing vesicles are transported to the perinuclear area by using microtubules (inhibition by nocodazole), where the maturation of stable large CPV-I is completed (step 4). The acidic nature of the late vesicles is indicated by pink coloring. wort., wortmannin; EE, early endosome; LE, late endosome. Representative EM images from each step of the RC trafficking are shown to the right of the model.

Similar articles

Cited by

References

    1. Acheson, N. H., and I. Tamm. 1967. Replication of Semliki Forest virus: an electron microscopic study. Virology 32:128-143. - PubMed
    1. Ahlquist, P., A. O. Noueiry, W. M. Lee, D. B. Kushner, and B. T. Dye. 2003. Host factors in positive-strand RNA virus genome replication. J. Virol. 77:8181-8186. - PMC - PubMed
    1. Ahola, T., P. Kujala, M. Tuittila, T. Blom, P. Laakkonen, A. Hinkkanen, and P. Auvinen. 2000. Effects of palmitoylation of replicase protein nsP1 on alphavirus infection. J. Virol. 74:6725-6733. - PMC - PubMed
    1. Ahola, T., A. Lampio, P. Auvinen, and L. Kääriäinen. 1999. Semliki Forest virus mRNA capping enzyme requires association with anionic membrane phospholipids for activity. EMBO J. 18:3164-3172. - PMC - PubMed
    1. Bain, J., L. Plater, M. Elliott, N. Shpiro, C. J. Hastie, H. McLauchlan, I. Klevernic, J. S. Arthur, D. R. Alessi, and P. Cohen. 2007. The selectivity of protein kinase inhibitors: a further update. Biochem. J. 408:297-315. - PMC - PubMed

Publication types

LinkOut - more resources