

Spatial attention improves the quality of population codes in human visual cortex
- PMID: 20484525
- PMCID: PMC2934940
- DOI: 10.1152/jn.00369.2010
Spatial attention improves the quality of population codes in human visual cortex
Abstract
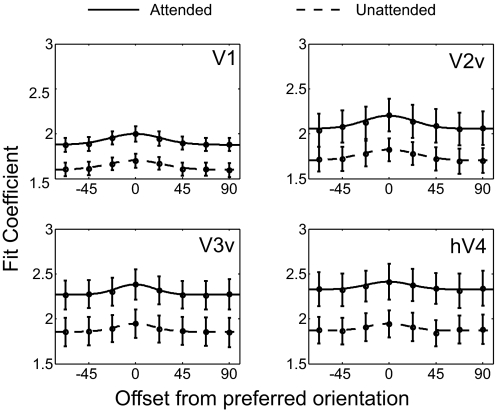
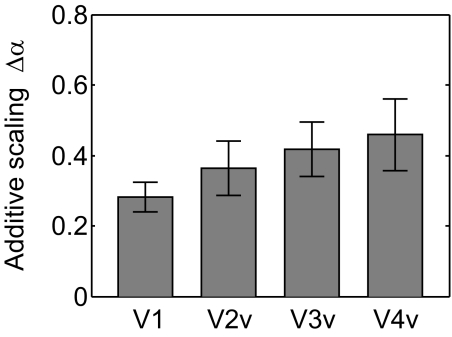
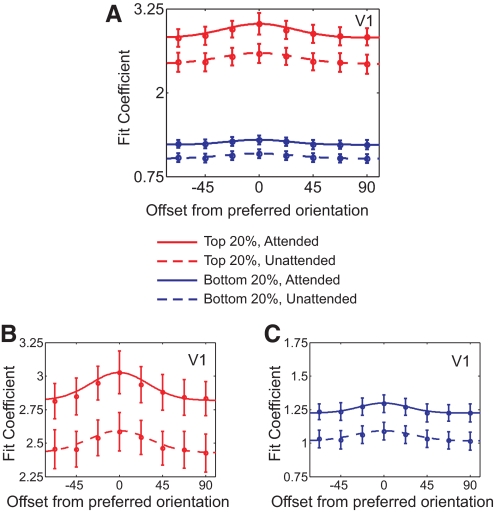
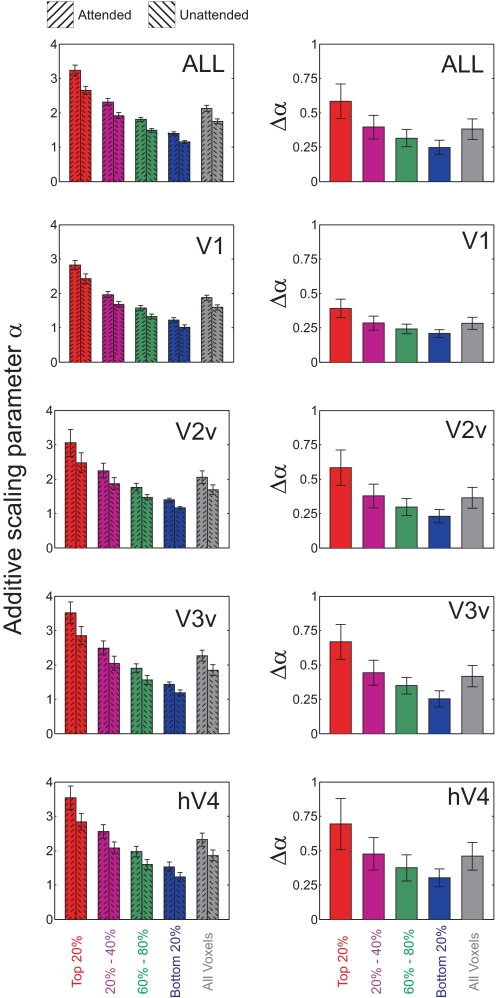
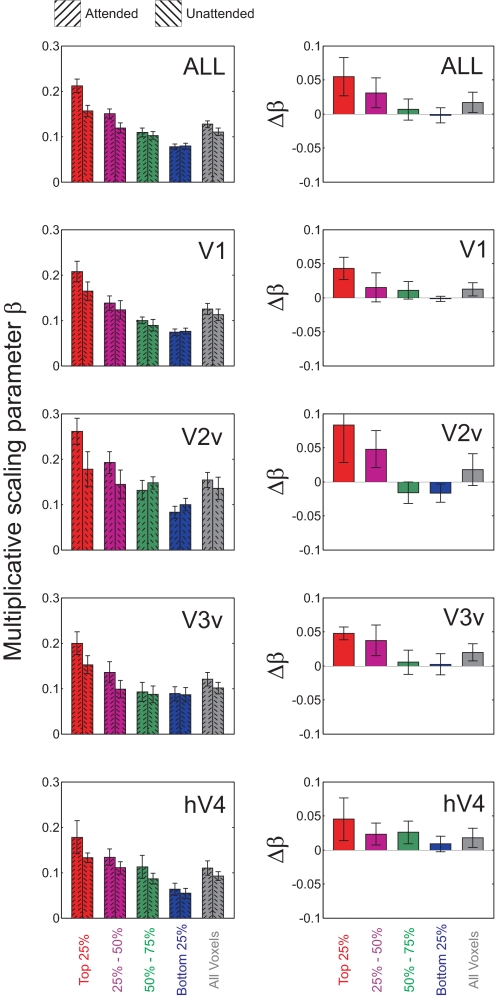
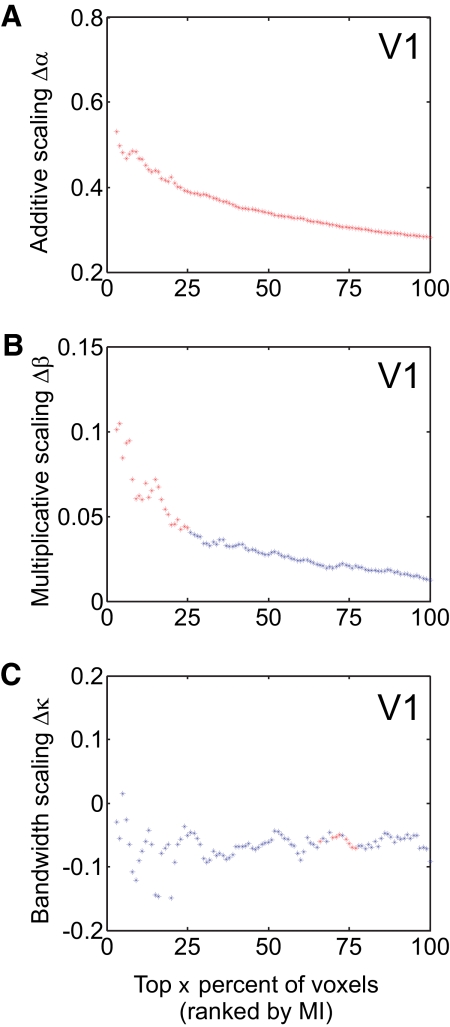
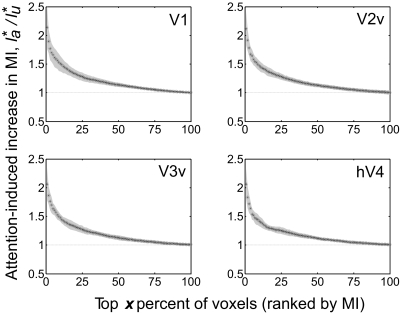
Selective attention enables sensory input from behaviorally relevant stimuli to be processed in greater detail, so that these stimuli can more accurately influence thoughts, actions, and future goals. Attention has been shown to modulate the spiking activity of single feature-selective neurons that encode basic stimulus properties (color, orientation, etc.). However, the combined output from many such neurons is required to form stable representations of relevant objects and little empirical work has formally investigated the relationship between attentional modulations on population responses and improvements in encoding precision. Here, we used functional MRI and voxel-based feature tuning functions to show that spatial attention induces a multiplicative scaling in orientation-selective population response profiles in early visual cortex. In turn, this multiplicative scaling correlates with an improvement in encoding precision, as evidenced by a concurrent increase in the mutual information between population responses and the orientation of attended stimuli. These data therefore demonstrate how multiplicative scaling of neural responses provides at least one mechanism by which spatial attention may improve the encoding precision of population codes. Increased encoding precision in early visual areas may then enhance the speed and accuracy of perceptual decisions computed by higher-order neural mechanisms.
Figures
Similar articles
-
Population response profiles in early visual cortex are biased in favor of more valuable stimuli.J Neurophysiol. 2010 Jul;104(1):76-87. doi: 10.1152/jn.01090.2009. Epub 2010 Apr 21. J Neurophysiol. 2010. PMID: 20410360 Free PMC article.
-
Attention improves encoding of task-relevant features in the human visual cortex.J Neurosci. 2011 Jun 1;31(22):8210-9. doi: 10.1523/JNEUROSCI.6153-09.2011. J Neurosci. 2011. PMID: 21632942 Free PMC article.
-
Estimating the influence of attention on population codes in human visual cortex using voxel-based tuning functions.Neuroimage. 2009 Jan 1;44(1):223-31. doi: 10.1016/j.neuroimage.2008.07.043. Epub 2008 Aug 5. Neuroimage. 2009. PMID: 18721888
-
Orienting of attention and spatial cognition.Cogn Process. 2024 Aug;25(Suppl 1):55-59. doi: 10.1007/s10339-024-01216-x. Epub 2024 Aug 10. Cogn Process. 2024. PMID: 39123061 Review.
-
Attentional enhancement of spatial resolution: linking behavioural and neurophysiological evidence.Nat Rev Neurosci. 2013 Mar;14(3):188-200. doi: 10.1038/nrn3443. Nat Rev Neurosci. 2013. PMID: 23422910 Free PMC article. Review.
Cited by
-
Perceptual learning selectively refines orientation representations in early visual cortex.J Neurosci. 2012 Nov 21;32(47):16747-53a. doi: 10.1523/JNEUROSCI.6112-11.2012. J Neurosci. 2012. PMID: 23175828 Free PMC article.
-
Model-Free Estimation of Tuning Curves and Their Attentional Modulation, Based on Sparse and Noisy Data.PLoS One. 2016 Jan 19;11(1):e0146500. doi: 10.1371/journal.pone.0146500. eCollection 2016. PLoS One. 2016. PMID: 26785378 Free PMC article.
-
Attention improves transfer of motion information between V1 and MT.J Neurosci. 2014 Mar 5;34(10):3586-96. doi: 10.1523/JNEUROSCI.3484-13.2014. J Neurosci. 2014. PMID: 24599458 Free PMC article. Clinical Trial.
-
Temporal Information Entropy of the Blood-Oxygenation Level-Dependent Signals Increases in the Activated Human Primary Visual Cortex.Front Phys. 2017;5:7. doi: 10.3389/fphy.2017.00007. Epub 2017 Feb 23. Front Phys. 2017. PMID: 28451586 Free PMC article.
-
Spatial attention, precision, and Bayesian inference: a study of saccadic response speed.Cereb Cortex. 2014 Jun;24(6):1436-50. doi: 10.1093/cercor/bhs418. Epub 2013 Jan 14. Cereb Cortex. 2014. PMID: 23322402 Free PMC article.
References
-
- Abbott LF, Dayan P. The effect of correlated variability on the accuracy of a population code. Neural Comput 11: 91–101, 1999 - PubMed
-
- Averbeck BB, Latham PE, Pouget A. Neural correlations, population coding and computation. Nat Rev Neurosci 7: 358–366, 2006 - PubMed
-
- Borst A, Theunissen FE. Information theory and neural coding. Nat Neurosci 2: 947–957, 1999 - PubMed
-
- Boynton GM. Attention and visual perception. Curr Opin Neurobiol 15: 465–469, 2005 - PubMed
Publication types
MeSH terms
Substances
Grants and funding
LinkOut - more resources
Full Text Sources
Other Literature Sources