

Discrimination of speech stimuli based on neuronal response phase patterns depends on acoustics but not comprehension
- PMID: 20484530
- PMCID: PMC2997028
- DOI: 10.1152/jn.00251.2010
Discrimination of speech stimuli based on neuronal response phase patterns depends on acoustics but not comprehension
Abstract
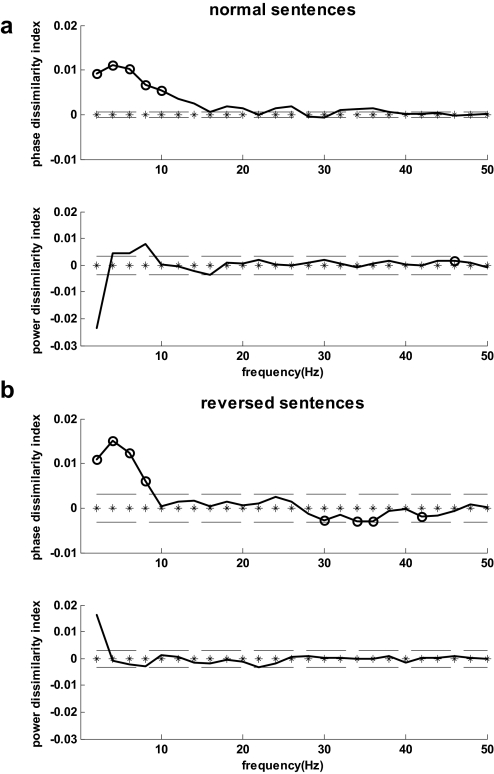
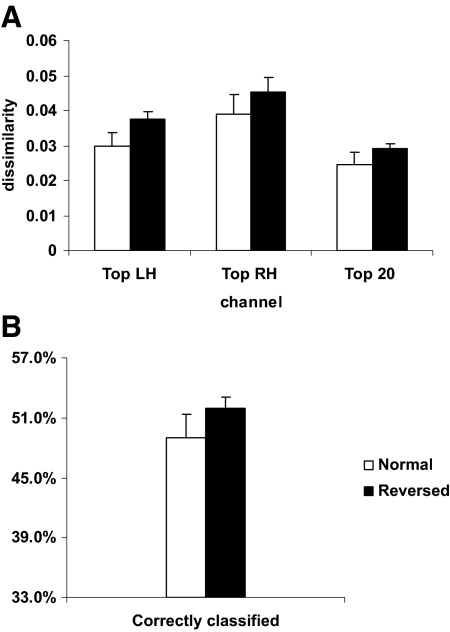
Speech stimuli give rise to neural activity in the listener that can be observed as waveforms using magnetoencephalography. Although waveforms vary greatly from trial to trial due to activity unrelated to the stimulus, it has been demonstrated that spoken sentences can be discriminated based on theta-band (3-7 Hz) phase patterns in single-trial response waveforms. Furthermore, manipulations of the speech signal envelope and fine structure that reduced intelligibility were found to produce correlated reductions in discrimination performance, suggesting a relationship between theta-band phase patterns and speech comprehension. This study investigates the nature of this relationship, hypothesizing that theta-band phase patterns primarily reflect cortical processing of low-frequency (<40 Hz) modulations present in the acoustic signal and required for intelligibility, rather than processing exclusively related to comprehension (e.g., lexical, syntactic, semantic). Using stimuli that are quite similar to normal spoken sentences in terms of low-frequency modulation characteristics but are unintelligible (i.e., their time-inverted counterparts), we find that discrimination performance based on theta-band phase patterns is equal for both types of stimuli. Consistent with earlier findings, we also observe that whereas theta-band phase patterns differ across stimuli, power patterns do not. We use a simulation model of the single-trial response to spoken sentence stimuli to demonstrate that phase-locked responses to low-frequency modulations of the acoustic signal can account not only for the phase but also for the power results. The simulation offers insight into the interpretation of the empirical results with respect to phase-resetting and power-enhancement models of the evoked response.
Figures

 ” marks.
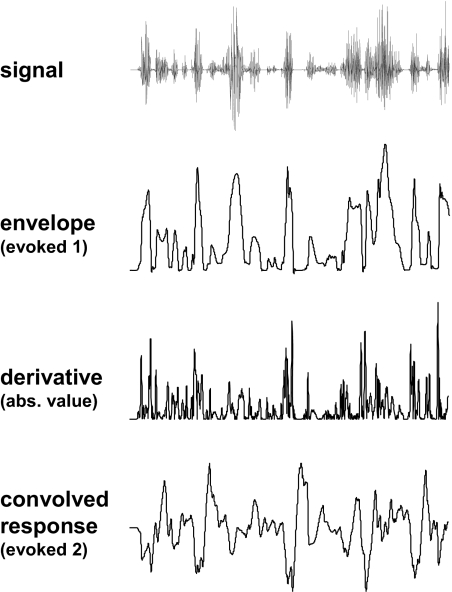

 ” marks.
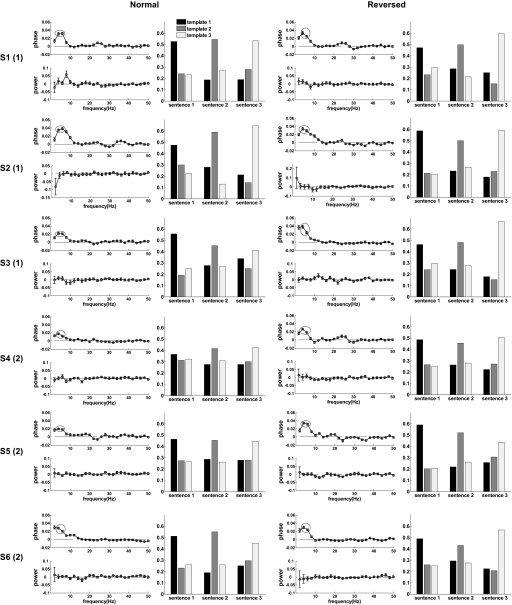

References
-
- Adachi Y, Shimogawara M, Higuchi M, Haruta Y, Ochiai M. Reduction of nonperiodic environmental magnetic noise in MEG measurement by continuously adjusted least square method. IEEE Trans Appl Superconduct 11: 669–672, 2001
-
- Aiken SJ, Picton TW. Human cortical responses to the speech envelope. Ear Hear 15: 139–157, 2008 - PubMed
-
- Arieli A, Sterkin A, Grinvald A, Aertsen A. Dynamics of ongoing activity: explanation of the large variability in evoked cortical responses. Science 273: 1868–1871, 1996 - PubMed
Publication types
MeSH terms
Grants and funding
LinkOut - more resources
Full Text Sources