. 2010 Jul;104(1):291-9.
doi: 10.1152/jn.00034.2010. Epub 2010 May 19.

Gain of function in FHM-1 Cav2.1 knock-in mice is related to the shape of the action potential

Affiliations

Gain of function in FHM-1 Cav2.1 knock-in mice is related to the shape of the action potential

Carlota González Inchauspe et al. J Neurophysiol. 2010 Jul.

Abstract

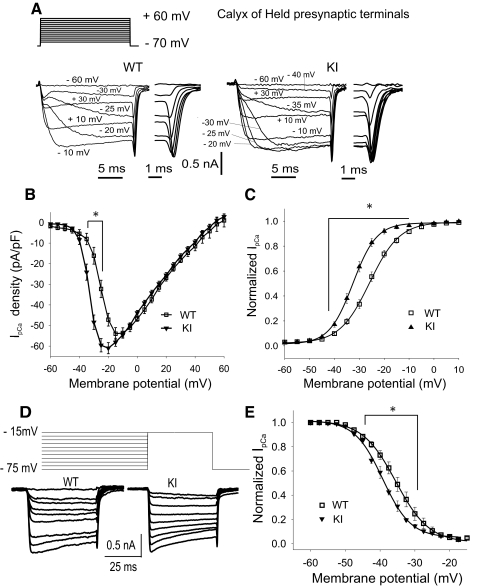
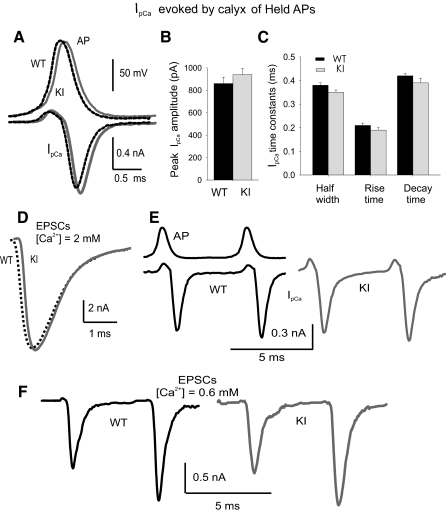
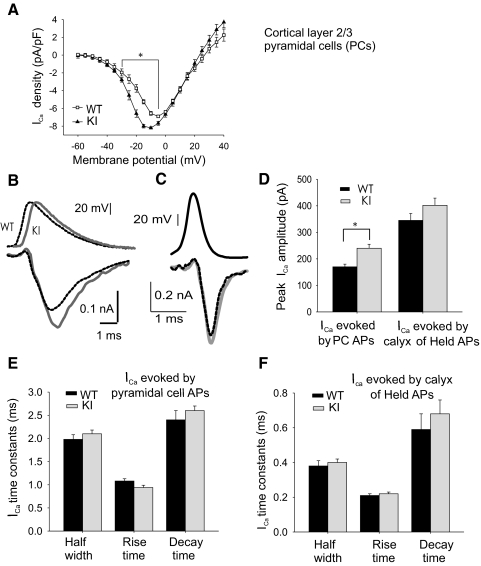
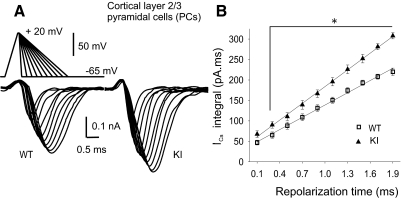
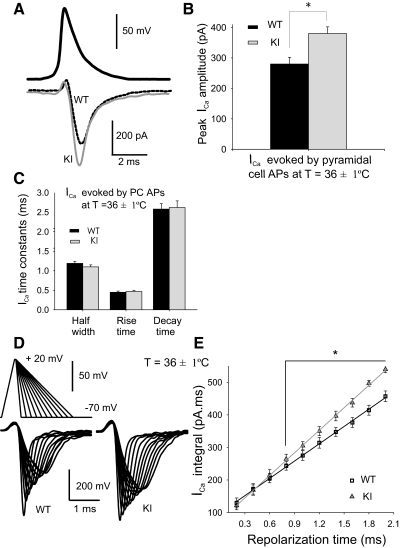
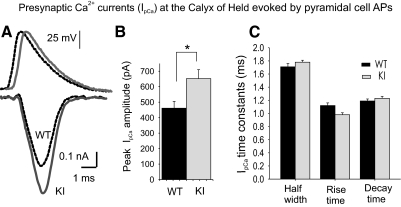
Familial hemiplegic migraine type-1 FHM-1 is caused by missense mutations in the CACNA1A gene that encodes the alpha(1A) pore-forming subunit of Ca(V)2.1 Ca(2+) channels. We used knock-in (KI) transgenic mice harboring the pathogenic FHM-1 mutation R192Q to study neurotransmission at the calyx of Held synapse and cortical layer 2/3 pyramidal cells (PCs). Using whole cell patch-clamp recordings in brain stem slices, we confirmed that KI Ca(V)2.1 Ca(2+) channels activated at more hyperpolarizing potentials. However, calyceal presynaptic calcium currents (I(pCa)) evoked by presynaptic action potentials (APs) were similar in amplitude, kinetic parameters, and neurotransmitter release. Ca(V)2.1 Ca(2+) channels in cortical layer 2/3 PCs from KI mice also showed a negative shift in their activation voltage. PCs had APs with longer durations and smaller amplitudes than the calyx of Held. AP-evoked Ca(2+) currents (I(Ca)) from PCs were larger in KI compared with wild-type (WT) mice. In contrast, when I(Ca)was evoked in PCs by calyx of Held AP waveforms, we observed no amplitude differences between WT and KI mice. In the same way, Ca(2+) currents evoked at the presynaptic terminals (I(pCa))of the calyx of Held by the AP waveforms of the PCs had larger amplitudes in R192Q KI mice that in WT. These results suggest that longer time courses of pyramidal APs were a key factor for the expression of a synaptic gain of function in the KI mice. In addition, our results indicate that consequences of FHM-1 mutations might vary according to the shape of APs in charge of triggering synaptic transmission (neurons in the calyx of Held vs. excitatory/inhibitory neurons in the cortex), adding to the complexity of the pathophysiology of migraine.


Figures

Fig. 1.
Fig. 1.
Properties of presynaptic Ca2+ currents at the calyx of Held from wild-type (WT) and R192Q knock-in (KI) mice. A: IpCa evoked (bottom) by 20 ms depolarizing voltage steps (top) from −75 mV to potentials ranging −60 to 60 mV (5 mV steps). Right insets: tail currents elicited after repolarization to −75 mV. B: I/V relationship for IpCa from WT (n = 17) and R192Q KI (n = 26). C: IpCa activation curves: normalized amplitudes of tail currents plotted against voltage and fitted by the Boltzmann's function: I(V) = {1/[(1 + exp [(VV1/2)/k]}. Half-activation voltages (V1/2) were −32.4 ± 0.3 mV for R192Q KI (n = 26) and −25.9 ± 0.2 mV for WT (Student's t-test, P = 6 × 10⁻⁶, n = 17) and slope factors (k) 4.75 ± 0.25 and 6.0 ± 0.2 mV (P = 0.035, Student's t-test) for R192Q KI and WT, respectively. D: IpCa evoked by a 50 ms voltage step to the peak of the I-V curve after applying conditioning prepulses for 2.5 s to different voltages from −75 to −15 mV (2.5 mV steps). E: steady-state inactivation of IpCa from R192Q KI and WT terminals. Data are normalized to the maximum peak amplitude, plotted against the conditioning voltage and fitted by the Boltzmann's function. Half-inactivation voltages V1/2 were significantly more negative (−39.2 ± 0.2 mV, n = 12) for R192Q KI compared with WT (−35.5 ± 0.1 mV, n = 6; Student's t-test, P = 0.017). Slopes were −4.0 ± 0.2 and −4.8 ± 0.1 mV (Student's t-test, P = 0.06) for R192Q KI and WT, respectively. *Significant differences between WT and R192Q KI mice (P < 0.001, 1-way ANOVA RM, Student-Newman-Keuls post hoc).
Fig. 2.
Fig. 2.
Action potential (AP)-evoked presynaptic calcium currents (IpCa) and excitatory postsynaptic currents (EPSCs) at calyx of Held from WT and R192Q KI mice. A: Top traces: average APs waveforms at the calyx of Held from WT (dotted black, n = 4) and R192Q KI (gray, n = 3) mice. Mean potential amplitude was 110 ± 2 and 112 ± 2 mV, half-width was 0.44 ± 0.02 and 0.44 ± 0.03 ms, rise time (10–90%) was 0.33 ± 0.02 and 0.31 ± 0.04 ms, and decay time was 0.40 ± 0.02 and 0.44 ± 0.04 ms for WT and R192Q KI mice, respectively. Bottom traces: mean IpCa elicited by APs (dotted black and gray traces for WT and R192Q KI, respectively). B: mean IpCa amplitudes evoked by APs at the calyx of Held presynaptic terminals are not significantly different between WT and R192Q KI mice. C: kinetic parameters of presynaptic Ca2+ currents at the calyx of Held synapses generated by their own APs (n = 30 for WT and n = 48 for R192Q KI mice). D: representative EPSCs evoked in medial nucleus of the trapezoid body (MNTB) neurons from WT (dotted black) and R192Q KI (gray) mice at a holding potential of −70 mV in 2 mM [Ca2+]o artificial cerebrospinal fluid (ACSF). E: presynaptic Ca2+ current facilitation. Pairs of AP waveforms evoked IpCa, showing activity-dependent facilitation in WT and R192Q KI. Mean pair pulse facilitation was 12 ± 2% in R192Q KI (n = 12) and 10 ± 1% in WT mice (n = 10). F: facilitation of EPSCs. A pair of stimuli was applied with a short interval (10 ms). In low external Ca2+ concentration (0.6 mM) and high external Mg2+ concentration (2 mM), the EPSC evoked by the second stimulus is facilitated with respect to the first EPSC in synapses from both WT (45 ± 3%, n = 5) and R192Q KI mice (44 ± 2%, n = 7).
Fig. 3.
Fig. 3.
AP-evoked P/Q-type Ca2+ currents (ICa) in layer 2/3 pyramidal cells (PC) from WT and KI cortical slices. A: P/Q-type current density as a function of voltage in WT and R192Q KI layer 2/3 pyramidal cells (PCs). Normalized I-V curves were multiplied by the average maximal current density (6.9 ± 0.3 pA/pF, n = 7 for WT and 8.2 ± 0.2 pA/pF, n = 7 for KI). *Significant differences between WT and R192Q KI mice (P < 0.001, 1-way ANOVA RM, Student-Newman-Keuls post hoc). B: top traces: AP waveforms recorded in PCs (dotted black for WT and gray for R192Q KI mice, offset for better visualization). WT PCs had APs with a mean rise time of 0.53 ± 0.05 ms; half-width of 1.97 ± 0.08 ms; decay time of 3.1 ± 0.2 ms; and potential amplitude of 90 ± 2 mV (n = 5). Similar values were measured from KI mice (rise time: 0.52 ± 0.07 ms; half-width: 1.72 ± 0.12 ms; decay time: 2.9 ± 0.4 ms; potential amplitude: 92 ± 2 mV; n = 6). Bottom traces: ICa elicited by the above APs in the same cells (black for WT and gray for R192Q KI mice). C: ICa in PC (bottom traces, dotted black for WT, gray for KI mice) evoked by the AP waveforms (top traces) recorded at the calyx of Held presynaptic terminals. D: mean ICa amplitude evoked in PCs by either AP waveforms showed in B and C. ICa amplitudes from KI PCs (240 ± 15 pA, n = 25) are 41% larger than those from WT PCs (170 ± 10 pA, n = 18, P = 0.01) when evoked by PC APs. ICa was not statistically different when evoked by calyx of Held APs. Mean amplitudes were 402 ± 27 pA for R192Q KI mice (n = 25) and 345 ± 26 pA for WT mice (n = 18; Student's t-test, P = 0.07). E: kinetic parameters of Ca2+ currents generated in PCs by AP waveforms corresponding to the same cells (n = 18 for WT and n = 25 for R192Q KI mice). F: kinetic parameters of Ca2+ currents generated in PCs by AP waveforms of the calyx of Held (n = 18 for WT and n = 25 for R192Q KI mice).
Fig. 4.
Fig. 4.
Dependence of calcium influx with the AP repolarization rate. A: recordings of ICa in response to AP-like voltage ramps (from −65 to +20 mV, rise time of 0.5 ms, plateau duration of 0.05 ms, and increasing decay times from 0.1 to 1.9 ms with 0.2 ms increments) in WT and R192Q KI pyramidal cells. B: ICa-mediated charge (ICa integral) is plotted as a function of the AP repolarization time. Solid lines show the linear regression of the data. Slope value is larger for R192Q KI mice (136 ± 3 pA, n = 12) than for WT mice (99 ± 3 pA, n = 13, Student's t-test, P = 0.002). *Significant differences between WT and R192Q KI mice (P < 0.006, 1-way ANOVA RM, Student-Newman-Keuls post hoc).
Fig. 5.
Fig. 5.
AP-evoked P/Q-type Ca2+ currents (ICa) in layer 2/3 pyramidal cells (PCs) from WT and KI cortical slices at physiological temperature. A: top traces: AP waveforms recorded in PCs at physiological temperature (36 ± 1°C). Mean rise time was 0.41 ± 0.03 ms; half-width was 0.93 ± 0.04 ms; decay time was 1.9 ± 0.3 ms; and potential amplitude was 85 ± 3 mV (n = 6). Bottom traces: ICa elicited by the above APs in PC at physiologival temperature (black for WT and gray for R192Q KI mice). B: mean ICa amplitude evoked in PCs by their own APs at physiological temperature are 35% larger in R192Q KI mice (380 ± 22, n = 27, P = 0.001 Student's t-test) than in WT mice (280 ± 22 pA, n = 32). C: kinetic parameters of Ca2+ currents generated in PCs by AP waveforms corresponding to the same cells (n = 32 for WT and n = 27 for R192Q KI) at 36 ± 1°C. D: recordings of ICa in response to AP-like voltage ramps (from −65 to +20 mV, rise time of 0.5 ms, plateau duration of 0.05 ms, and increasing decay times from 0.1 to 2.1 ms with 0.2 ms increments) in WT and R192Q KI pyramidal cells at 36 ± 1°C. E: ICa-mediated charge (ICa integral) is plotted as a function of the AP repolarization time. Solid lines show the linear regression of the data. Slope value is larger for R192Q KI mice (230 ± 3 pA, n = 18) than for WT mice (177 ± 2 pA, n = 18, Student's t-test, P = 0.008). *Significant differences between WT and R192Q KI mice (P < 0.005, 1-way ANOVA RM, Student-Newman-Keuls post hoc).
Fig. 6.
Fig. 6.
IpCa at the calyx of Held evoked by long AP waveforms recorded at pyramidal cells (PCs). A: top traces: AP waveforms recorded in PCs (dotted black for WT and gray for R192Q KI mice, offset for better visualization, see parameters in Fig. 3B). Bottom traces: IpCa elicited by the above APs at the calyx of Held presynaptic terminals (dotted black for WT and gray for R192Q KI mice). B: mean IpCa amplitudes evoked at the calyx of Held presynaptic terminals by the PCs APs are 41% larger in KI mice (650 ± 58 pA, n = 24) than in WT mice (460 ± 44 pA, n = 11, P = 0.018, Student's t-test). C: kinetic parameters of presynaptic Ca2+ currents at the calyx of Held synapses generated by AP waveforms from pyramidal cells (n = 11 for WT and n = 24 for R192Q KI mice).

References

    1. Ali AB, Bannister AP, Thomson AM. Robust correlations between action potential duration and the properties of synaptic connections in layer 4 interneurones in neocortical slices from juvenile rats and adult rat and cat. J Physiol 580: 149–169, 2007 - PMC - PubMed
    1. Aurora SK, Wilkinson F. The brain is hyperexcitable in migraine. Cephalalgia 27: 1442–1453, 2007 - PubMed
    1. Barrett CF, Cao YQ, Tsien RW. Gating deficiency in a familial hemiplegic migraine type 1 mutant P/Q-type calcium channel. J Biol Chem 280: 24064–24071, 2005 - PubMed
    1. Bischofberger J, Geiger JR, Jonas P. Timing and efficacy of Ca2+ channel activation in hippocampal mossy fiber boutons. J Neurosci 22: 10593–10602, 2002 - PMC - PubMed
    1. Borst JG, Sakmann B. Effect of changes in action potential shape on calcium currents and transmitter release in a calyx-type synapse of the rat auditory brainstem. Philos Trans R Soc Lond B Biol Sci 354: 347–355, 1999 - PMC - PubMed

Publication types

MeSH terms

LinkOut - more resources